
Blog
WGU C218 Task 1 Guide and Example: Investor Pitch Presentation

Updated on: Aug 28, 2026
You’ve opened C218, run a few quarters of the simulation, and now you’re looking at Capsim reports full of numbers, wondering which ones actually belong in your Task 1 presentation and which ones are just noise. That gap, between having simulation data and knowing what to do with it, is where most students lose time on this task.
WGU C218 Task 1 isn’t a PowerPoint-design exercise. It’s an investor pitch, and a pitch only works if it connects simulation decisions → business results → analysis → investor story. Slides with good formatting and no analytical thread behind them read as decoration, not as a case for investment.
This guide walks through how the C218 simulation feeds into Task 1, what to track while you’re running it, how to turn that data into real analysis, how to structure the presentation itself, how to review your work before submitting, and where Task 1 fits alongside Task 2 and Task 3. It’s built for working MBA students who don’t have hours to spare reverse-engineering the assignment from scratch.
Read our C218 Task 1: Investor Presentation Guide (With a Worked Example)

What Is WGU C218 Task 1?
WGU C218 Task 1 is an investor pitch presentation built from your Capsim business simulation results. You present your company’s performance over the simulation quarters your task covers, explain the strategic decisions behind that performance, and make a case to a simulated investor audience for why your company deserves further investment.
The presentation isn’t graded on how well your simulated company performed. It’s graded on the quality of your analysis and reasoning, whether you can explain what you decided, why, what happened as a result, and what you’d do differently. Exact component requirements, quarter coverage, and submission format can vary between course versions, so verify all of that against your current WGU task instructions and rubric before you start building slides.
What Is the WGU C218 Capstone?
C218 is the capstone course for WGU’s MBA IT Management track, the culminating course where you apply strategy, finance, operations, and marketing knowledge from earlier coursework to one connected business scenario instead of separate assignments. Rather than a proctored final exam, the course centers on a business simulation, and your Performance Assessment tasks ask you to demonstrate what you learned from running it.
That structure means C218 tests something different from a typical course: not whether you can define a concept, but whether you can make a real decision under uncertainty, watch the consequences play out, and explain your reasoning to someone with money on the line. An investor doesn’t want a summary of what happened. They want to know you understand why it happened and what you’ll do next.
What Is the WGU C218 Simulation?
Inside the simulation, you’re making ongoing strategic and tactical decisions, pricing, production, R&D, marketing, and financing, for a fictitious company competing against other simulated firms. Each round, the simulation calculates results based on your choices and your competitors’, and those results become the raw material for your Task 1 analysis.
Because your decisions compound over multiple rounds, treating each quarter as an isolated event misses the point. A pricing decision in an early round shapes the market position you’re defending three rounds later. The simulation is a connected business story, not a series of unrelated snapshots, and your presentation should read that way too.
A simple framework for working through any decision you want to analyze:
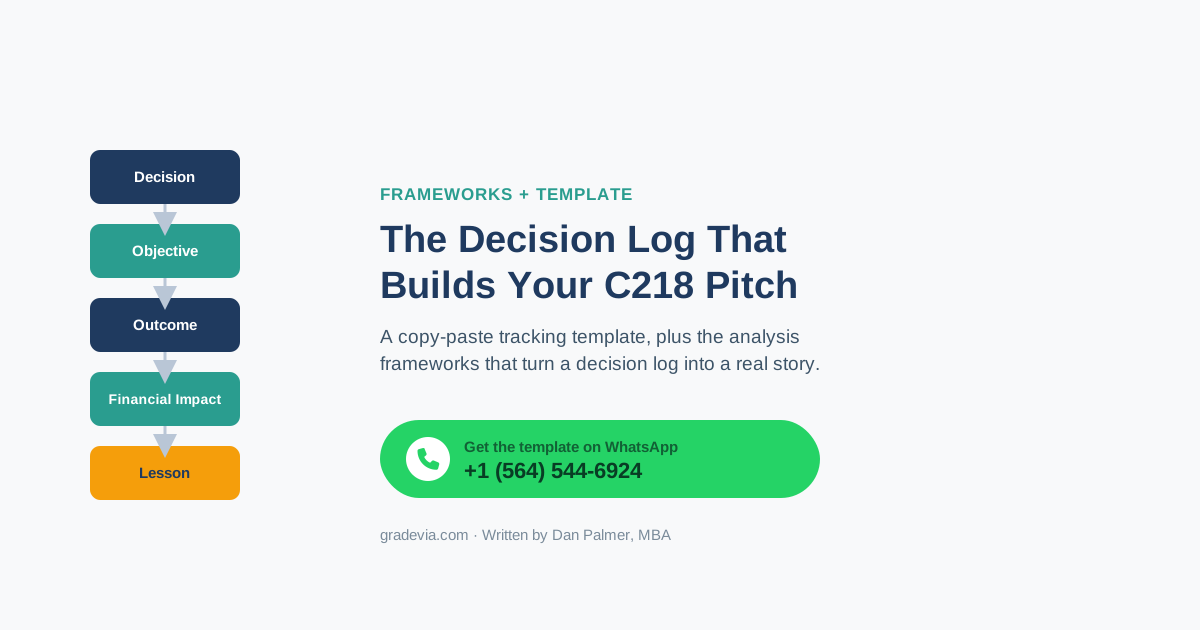
Decision → Objective → Outcome → Financial/Market Impact → Lesson
- Decision: What did you actually choose to do?
- Objective: What were you trying to achieve with that choice?
- Outcome: What happened as a result?
- Financial/Market Impact: How did it move your numbers, revenue, share, margin, cash?
- Lesson: What does that tell you, and what would you do differently or repeat?
Running your key decisions through this same five-step sequence keeps your analysis consistent and makes it far easier to write the presentation once you sit down to build it.
WGU C218 Simulation: What Should You Track?
Not everything the simulation generates ends up in Task 1, but not knowing what you’ll need until you need it is how students end up re-digging through old reports the week before a deadline. Track broadly as you go; you can decide what’s relevant once you know your current task requirements.
| Information to Track | Why It Matters | Where It May Help |
|---|---|---|
| Strategic decisions | Shows what management chose and why | Task 1 analysis |
| Financial results | Demonstrates business performance | Investor pitch |
| Market performance | Shows competitive position | Task 1 |
| Tactical decisions | Shows future strategic direction | Tactical plan |
| Performance trends | Demonstrates change over time, not a single snapshot | Analysis sections |
| Team decisions | Supports leadership and team-performance discussion | Task 1 |
| Scorecard information | Shows performance beyond pure financials | Relevant analysis sections |
Not every item here will be mandatory for your specific submission. Treat it as a checklist of what’s worth saving as you go, and let your current rubric tell you what’s actually required.
WGU C218 Simulation Quarters Explained
Most descriptions of the C218 simulation frame it as progressing across several quarters, with your strategic focus shifting as more data accumulates:
| Quarter | What to Focus On | What to Record |
|---|---|---|
| Q1 | Initial strategy and getting oriented | Your decisions and the assumptions behind them |
| Q2 | Early results | What changed, and how outcomes compared to expectations |
| Q3 | Performance trends | Where you’re strong, where you’re weak |
| Q4 | Tactical planning | The direction you’re taking next and why |
| Q5 | Strategic refinement | How performance is shifting as adjustments take hold |
| Q6 | Later-stage results | The evidence you’ll lean on most in your analysis |
Don’t treat this as a list of required decisions per quarter, it’s a general shape, not a script. Some C218 course versions run the full simulation across more quarters than Task 1 itself analyzes (commonly, Task 1 focuses on an earlier window of results while the simulation continues afterward). Confirm which quarters your specific task covers, and what decisions are actually available to you, inside your current course.
WGU MBA Capstone Simulation Tips That Actually Help
Tip 1: Keep a decision log. A simple running record, one row per decision, saves real time later:
| Quarter | Decision | Why | Expected Result | Actual Result |
|---|---|---|---|---|
Tip 2: Save your reports as you go. Income statements, balance sheets, cash flow statements, market share and segment data, whatever your simulation generates each round. Don’t rely on being able to pull old-round data later.
Tip 3: Write down why you made a decision when you make it. Three or four rounds later, you won’t remember your exact reasoning, and Task 1 specifically asks you to explain it.
Tip 4: Track trends, not isolated numbers. One quarter’s result rarely tells the full story. A dip that’s part of a recovery reads very differently from a dip that’s part of a slide, and you can only tell the difference if you’re looking at the sequence.
Tip 5: Connect financial and market results. A market share gain that comes with a shrinking margin is a different story than a market share gain with margin intact. Look at both together, not as separate threads.
Tip 6: Don’t try to fix everything at once. Trying to correct every weak area in a single round usually means none of them get enough resources to actually move. Prioritize.
Tip 7: Keep actual results separate from projections. Your Task 1 performance analysis should describe what happened. Your forward-looking sections describe what you expect to happen. Mixing the two makes your analysis harder to trust.
Tip 8: Start organizing Task 1 before the simulation is finished. Draft your performance narrative as results come in rather than waiting until every round is complete, then refine it once your simulation window closes.
Tip 9: Use your own simulation data. Every student’s simulated company performs differently based on their own decisions. Someone else’s numbers, or a “C218 Task 1 answers” document built on another student’s results, won’t match your company and won’t hold up under a rubric that grades on specificity.
Tip 10: Check your current rubric before you rely on any outside guide, including this one. C218’s requirements can shift between course versions. Treat this guide as a framework for thinking, and your active rubric as the authority on what’s actually required.
WGU C218 Task 1: What You Actually Need to Do
1. Understand the Investor Perspective
Before writing anything, sit with one question: what would an investor actually want to know before putting money into this business? Generally, that’s the business opportunity, market performance, financial performance, strategic direction, risks, future opportunities, and whether management seems capable of executing. Every section of your pitch should be answering some version of that question, not just reporting a number because the simulation generated it.
2. Analyze Market Performance
Work through market results with this sequence:
What happened? → Why did it happen? → What decision influenced it? → What does it mean for the business? → What should management do next?
Hypothetical example, not simulation data: Say a company’s share in one segment rose several points in a round. Weak version: “Share increased in that segment.” Stronger version: “Share increased in that segment following a price adjustment made the prior round; the timing suggests price was a meaningful driver, though a broader increase in segment demand may have also contributed. Going forward, monitoring whether the gain holds without further price movement would help confirm the cause.”
3. Analyze Financial Performance
The same upgrade applies to financial results. “Revenue increased” is a description. What investors need is: what changed, why it changed, how significant the change actually was, what it did to profitability, what an investor might reasonably infer from it, and what management should do next. If you use illustrative numbers to explain this to yourself while drafting, keep them clearly separate from your actual simulation figures.
4. Identify Important Strategic Decisions
Not every decision you made deserves space in the presentation, pick the ones that actually moved outcomes. For each one:
Decision → Reason → Outcome → Impact → Lesson
Fill-in-the-blank version you can use directly: “We decided to ______ because ______. The result was ______, which affected ______. Based on that outcome, we would ______.”
5. Explain the Company’s Strategy
Connect the dots from the top down: Mission → Objective → Strategy → Tactical Decision → Result. Your mission and objectives set the direction; your strategy is the approach you chose to get there; your tactical decisions are the specific moves inside the simulation; your results are what those moves produced. If a reader can’t trace a straight line from your stated strategy to your actual decisions, the strategy section reads as disconnected from everything else.
6. Analyze Team Strengths and Weaknesses
Generic statements like “our team communicated well” don’t tell an investor anything usable. Tie strengths and weaknesses to specific decisions and outcomes instead: what did the team do well that showed up in a result, and where did a gap in coordination or analysis actually cost the company something measurable.
7. Address the Team Contract
If your course involves a team contract covering responsibilities, communication norms, decision-making process, and conflict resolution, draw on your actual experience with it rather than inventing generic statements. How your team actually handled disagreements or split responsibilities is more useful material than a template answer.
WGU C218 Task 1 Presentation: How to Build the Investor Pitch
Think of the presentation as telling one coherent business story, not eight disconnected slides. A structure that generally works well:
- Opening: What is the company, and what’s the opportunity?
- Business Strategy: What’s the strategic direction, and why?
- Market Performance: What happened in the market?
- Financial Performance: What happened financially?
- Key Decisions: Which management decisions mattered most, and why?
- Team Performance: What did management do well or poorly?
- Future Direction: Where is the company headed from here?
- Investor Proposition: Why should an investor care?
Treat this as a recommended logical structure, not an official required slide list. If your current WGU task instructions or rubric specify a different structure or slide count, follow those over this outline.
C218 Task 1 PowerPoint: How to Make It More Professional
- One main idea per slide. If a slide is trying to make three points, it’s making none of them clearly.
- Minimal text. A slide is a visual aid for what you’re saying, not a script to be read aloud.
- Readable charts with labeled axes, not screenshots of raw simulation output.
- Consistent terminology across every slide, don’t rename the same metric twice.
- Headings that say something, not just “Financial Performance” on every financial slide.
- Highlight the metrics that actually matter to your story; don’t bury them in a dense table.
- Skip decorative visuals that don’t communicate information.
- Keep the language professional throughout, this is an investor audience, not a classroom presentation.
An investor skimming your deck should be able to follow your argument from the visuals alone, with your narration adding depth rather than carrying the whole load.
How to Turn C218 Simulation Data Into Analysis
Weak: “Sales increased in Q3.”
Better: “Sales increased in Q3 following changes to the company’s pricing strategy.”
Stronger: the strongest version connects Change + Cause + Evidence + Business Meaning + Next Action: what changed, what caused it, what evidence supports that connection, what it means for the business, and what you’ll do about it going forward. That five-part structure is what separates analysis from a data dump, and it’s worth applying consistently across every performance section in the presentation.
C218 Task 1 Answers: What You Need to Know
If you’re searching for “wgu c218 task 1 answers,” here’s the honest version: a generic answer set, or another student’s completed Task 1, won’t actually help you. Every student’s simulation results differ based on their own decisions, and the rubric grades on how specifically your analysis connects to your own company’s numbers. A copied or generic answer reads as disconnected from your actual results, which is exactly what the rubric is checking for.
What genuinely helps is understanding the analytical frameworks well enough to build your own answers from your own data. A few you can fill in directly:
Decision Analysis Framework: “My team decided to ______ because ______. The result was ______, which affected ______. Based on this outcome, we would ______.”
Financial Analysis Framework: “The company’s ______ changed from ______ to ______. This indicates ______. One likely factor was ______. From an investor perspective, this suggests ______.”
Strategy Framework: “Our strategy focused on ______. We implemented this through ______. The resulting performance indicates ______.”
These are educational frameworks to build your own analysis with, not submission-ready answers, and they only work when filled in with your actual simulation results.
WGU C218 Task 1 Review: How to Review Your Work Before Submission
Requirement check. Read your draft against your current rubric line by line. Does every required component actually appear?
Data check. Verify every number in your presentation against your actual simulation reports. A single mismatched figure undermines the credibility of everything around it.
Logic check. Does every major claim have evidence behind it, or are you asserting something the data doesn’t actually support?
Investor check. Read it as a skeptical investor would. Would they understand, from what’s on the page, why this business deserves attention?
Presentation check. Can someone follow a slide without reading a wall of text? If not, cut it down.
Recording check. If your submission requires a recorded presentation, verify audio and video quality, screen sharing, timing, and the exact submission format specified in your current WGU instructions before you submit.
C218 Task 1 Common Mistakes
- Using outdated guides. C218 requirements can change between course versions; verify against your current rubric.
- Copying another student’s simulation results. Your numbers are unique to your decisions.
- Treating this as a slide-design exercise. Good formatting without analysis behind it won’t satisfy the rubric.
- Listing numbers without analysis. A figure alone doesn’t demonstrate understanding.
- Making unsupported claims. Every interpretive statement needs evidence.
- Ignoring negative results. A dip you don’t address looks worse than one you explain.
- Failing to explain decisions. Results without the reasoning behind them read as arbitrary.
- Confusing projections with actual results. Keep what happened separate from what you expect to happen.
- Using excessive text on slides. If it needs to be read verbatim, it belongs in your notes, not the slide.
- Forgetting the investor perspective. Every section should answer some version of “why does this matter to someone deciding whether to invest.”
- Waiting until the end to organize simulation data. Reconstructing early-round reasoning from memory is harder and less accurate.
- Not checking the current rubric. The single most avoidable mistake on this list.
Each one has the same fix in common: slow down at the point where you’d normally skip a step, and do that step anyway.
WGU C218 Task 1 vs Task 2 vs Task 3
| Task 1 | Task 2 | Task 3 | |
|---|---|---|---|
| Main purpose | Present strategy and early performance as an investor pitch | Deeper business and financial performance analysis | Career management and professional reflection |
| Primary focus | Decisions, results, and the investor narrative | Ratios, financial statements, and business analysis over a longer window | Competencies, goals, and career planning |
| Simulation connection | Builds directly on your early-round simulation decisions and results | Builds on a longer stretch of simulation data | Draws on the program and simulation experience as a whole, not new simulation data |
| Typical deliverable | Investor pitch presentation | Written stockholder-style report | Career reflection and action plan |
| Best preparation strategy | Organize your decision log and reports as you go | Keep tracking data past Task 1’s window; don’t stop recording once Task 1 is submitted | Start early; it benefits from real reflection, not a rushed final draft |
Requirements for each task can vary by course version. Treat this table as orientation, and your current WGU task instructions as the authority on what’s actually required. For the full breakdown of the later tasks, see the WGU C218 Task 2 guide and the WGU C218 Task 3 guide, and the C218 capstone overview for how all three fit together.
How to Finish WGU C218 Task 1 Efficiently
Before the simulation:
- Understand what the task is actually asking you to demonstrate
- Set up a tracking spreadsheet
- Start a decision log from round one
During the simulation:
- Record each decision and your reasoning as you make it
- Save every report as it’s generated
- Note anything that surprised you, these often make the strongest analysis points
Before writing Task 1:
- Identify your strongest results and your weakest ones
- Select the decisions that actually mattered
- Organize your financial and market evidence by the story it supports
- Outline the presentation before you open PowerPoint
Before submission:
- Check your current rubric line by line
- Verify every number against your actual simulation data
- Rehearse the presentation out loud
- Review your recording, if one is required
- Submit in the exact format your current instructions specify
Most of the time lost on this task doesn’t happen while writing, it happens re-digging through old simulation rounds because nothing was organized along the way.
C218 Task 1 Data Tracking Template
A simple structure you can copy directly into Excel or Google Sheets:
| Quarter | Decision | Reason | Expected Result | Actual Result | Financial Impact | Market Impact | Lesson |
|---|---|---|---|---|---|---|---|
Fill in one row per meaningful decision as you go. By the time you sit down to write Task 1, you’ll have a ready-made source table instead of a memory-reconstruction project.
C218 Investor Pitch Framework
A concise way to see the whole narrative arc at once:
Problem/Opportunity → Business Strategy → Management Decisions → Simulation Results → Financial & Market Performance → Future Strategy → Investor Opportunity
Each stage sets up the next one. The opportunity motivates the strategy; the strategy explains the decisions; the decisions produced the results; the results shape what comes next; and everything before it builds the case for the investor ask at the end. If a section doesn’t connect to the one before or after it, that’s usually a sign it needs to be reworked or cut.
What If Your C218 Simulation Results Are Bad?
Weak simulation performance doesn’t automatically mean a weak Task 1 submission. What matters is whether you can demonstrate analytical ability regardless of outcome:
- Acknowledge the weak performance directly, don’t downplay or bury it
- Identify what actually caused it
- Explain the management decisions behind it honestly
- Name the lesson your team took from it
- Propose a specific corrective action going forward
- Never hide unfavorable data; a gap an investor notices themselves is far more damaging than one you addressed upfront
Investors, real or simulated, trust honest analysis of a setback more than an evasive summary of a win. A team that lost market share but can explain exactly why and what they changed demonstrates more analytical maturity than a team with strong numbers and no real explanation for them.
How to Use C218 Simulation Results for Later Tasks
Organized simulation records don’t stop being useful once Task 1 is submitted. WGU C218 Task 2 generally continues the same business analysis over a longer stretch of simulation data, and WGU C218 Task 3 draws on your broader experience across the program. Keep tracking decisions and results past your Task 1 window rather than assuming your data-collection job ends when Task 1 is submitted. Exactly how much of your Task 1 material carries forward depends on your current course structure, confirm that against your active task instructions rather than assuming.
Frequently Asked Questions About WGU C218 Task 1
What is WGU C218 Task 1? An investor pitch presentation built from your business simulation results, where you present performance, explain strategic decisions, and make an investment case grounded in your own data.
What is the WGU C218 simulation? A business simulation where you make ongoing strategic and tactical decisions for a fictitious company, with results calculated each round based on your choices and your competitors’.
Is C218 a capstone? Yes, it’s the capstone course for WGU’s MBA IT Management track.
What is the WGU C218 Capstone? The final course in the MBA IT Management track, combining a business simulation with a series of Performance Assessment tasks that ask you to analyze and reflect on your simulation experience.
What is the C218 investor pitch? The Task 1 deliverable: a presentation analyzing your company’s simulation performance and making a case for further investment.
Does C218 have a simulation? Yes, the simulation is the foundation the entire capstone is built on.
How many quarters are in the C218 simulation? This can vary by course version; verify the exact quarter count and which quarters your specific task covers against your current WGU instructions.
What should I track during the simulation? Strategic and tactical decisions, financial results, market performance, team decisions, and any scorecard data your simulation generates, along with a short note on your reasoning for each major decision.
What should be included in the C218 presentation? Generally company overview, strategy, market and financial performance, key decisions, team performance, future direction, and an investor proposition, confirmed against your current rubric.
What are WGU C218 Task 1 answers? There’s no universal answer set. Strong submissions are built from your own simulation data using consistent analytical frameworks, not copied or generic content.
Can I use another student’s C218 Task 1 answers? No. Every student’s simulation results are unique, and a copied or borrowed submission won’t match your data or satisfy a rubric that grades on specificity.
How should I review C218 Task 1? Check it against your current rubric, verify every number, confirm every claim has supporting evidence, read it from an investor’s perspective, and check your recording and submission format if applicable.
What is WGU C218 Task 2? The next deliverable in the capstone, generally a deeper business and financial analysis covering a longer stretch of simulation data. See the C218 Task 2 guide.
What is WGU C218 Task 3? The capstone’s career management component, covering professional competencies and career planning. See the C218 Task 3 guide.
How long does C218 Task 1 take? It varies by how organized your simulation records are and how much revision your submission needs. Staying organized from round one saves the most time.
How can I finish C218 faster? Track decisions as you make them, save reports as they’re generated, and build your presentation outline before the simulation window closes rather than starting from a blank page afterward.
What are the best WGU MBA capstone simulation tips? Keep a decision log, save every report, separate actual results from projections, track trends instead of single-quarter snapshots, and use your own data, not another student’s.
Where This Leaves You
C218 Task 1 rewards organization more than it rewards writing speed. If you’re tracking decisions and saving reports as you go, building the actual presentation is mostly assembly. If you’re not, it becomes a reconstruction project under deadline pressure. The frameworks in this guide, decision-to-lesson, change-to-next-action, mission-to-result, are meant to make that assembly faster whichever stage you’re at right now.
If you’re a working MBA student trying to fit C218 around a full-time job and you want a second set of eyes on your simulation analysis or presentation structure before you submit, message Gradevia on WhatsApp at +1 (564) 544-6924. We can help you work through your simulation results, organize your analysis, and review your draft against the current rubric, so you’re submitting with confidence instead of guesswork.