
Blog
WGU C207 Task 2: Complete Guide to Decision Tree Analysis (2026)

What Is WGU C207 Task 2?
WGU C207 — Data-Driven Decision Making — is a core course in Western Governors University’s MBA and business programs. The course contains two performance assessments (Tasks) and one objective assessment (OA). While Task 1 focuses on linear regression analysis, Task 2 requires students to conduct a full decision tree analysis for a pharmaceutical company scenario called Major Pharmaceutical Company (MPC).
Unlike most WGU courses where students can rely on memorization, C207 Task 2 demands applied quantitative reasoning: you must calculate expected values, construct a visual decision tree, justify your methodology, and identify real-world limitations of the analysis. Most submitted examples available online miss at least two or three rubric requirements — this guide closes those gaps completely.
What Does C207 Task 2 Actually Ask You to Do?
The task revolves around a fictional scenario in which MPC must decide between three strategic options in response to competitive pressure from newly FDA-approved rival drugs:
- Develop a new drug line
- Exploit (modify) the existing drug line for new applications
- Make no changes to current operations
Your job as an analyst is to use decision tree analysis to determine which option yields the highest Expected Value (EV) given market probabilities and demand data provided in your personalized Excel dataset.
Important: Every student receives a unique dataset tied to their WGU student ID. The numbers in sample papers on Studocu, CliffsNotes, or Course Sidekick will not match yours. The methodology, however, is universal — and that is what this guide teaches.
The C207 Task 2 Rubric — Broken Down
Understanding the rubric is the single most important step. Below is a summary of the core sections you must address:
| Rubric Section | What You Must Deliver |
|---|---|
| A — Business Question | State the business problem as a question that decision tree analysis can answer |
| B — Relevant Data | Present the data table: profit per unit, favorable/unfavorable demand, probabilities |
| C — Decision Tree Diagram | Visual tree with all branches, payoffs, probabilities, and expected values labeled |
| C2 — Justification of Technique | Explain why decision tree analysis is appropriate for this scenario |
| D — Expected Value Calculations | Show full EV calculations with two decimal places for each option |
| D2 — Limitations | Identify at least two non-financial or analytical limitations of your decision tree |
| E — Recommendation | State which option MPC should choose and why, based on EV results |
Important: Most student sample papers available online address sections A–D adequately but give weak or one-sentence responses to the Limitations (D2) section and skip discussing the non-financial factors entirely. This is one of the most common reasons students receive revision requests.
Step-by-Step: How to Complete C207 Task 2
Step 1: Frame the Business Question
Your business question should be specific and answerable through quantitative analysis. A strong example:
“Given emerging competition from newly FDA-approved drug products, should MPC develop a new drug line, modify the existing drug line for expanded applications, or continue with current operations — and which option produces the highest expected monetary value?”
Avoid vague questions like “What should MPC do?” The rubric expects a question that explicitly invites decision tree analysis as the solution tool.
Step 2: Extract and Organize Your Data
From your personalized Excel dataset, you will find the following data points for each strategic option:
- Profit per unit (in dollars)
- Favorable market demand (units/month)
- Unfavorable market demand (units/month)
- Probability of favorable market (as a decimal, e.g., 0.72)
- Probability of unfavorable market (as a decimal; must sum to 1.00 with favorable probability)
Organize this into a clean table before you begin calculations. Here is a sample data structure (your numbers will differ):
| Decision Option | Profit/Unit | Favorable Demand | Unfavorable Demand | P(Favorable) | P(Unfavorable) |
|---|---|---|---|---|---|
| New Drug Line | $0.67 | 4,966 units | 1,205 units | 0.77 | 0.23 |
| Modify Existing Line | $0.99 | 5,377 units | 1,807 units | 0.61 | 0.39 |
| No Changes | $0.83 | 1,101 units | 541 units | 0.89 | 0.11 |
Note: These are illustrative values from published sample submissions. Your dataset will have different figures.
Step 3: Calculate Payoff Values
Before computing expected values, you must calculate the payoff for each market condition and each option. The formula is:
Payoff = Profit per Unit × Monthly Demand
Using the sample data above:
| Option | Favorable Payoff | Unfavorable Payoff |
|---|---|---|
| New Drug Line | $0.67 × 4,966 = $3,327.22 | $0.67 × 1,205 = $807.35 |
| Modify Existing | $0.99 × 5,377 = $5,323.23 | $0.99 × 1,807 = $1,788.93 |
| No Changes | $0.83 × 1,101 = $913.83 | $0.83 × 541 = $449.03 |
Step 4: Calculate Expected Values

The Expected Value (EV) formula is:
EV = (Favorable Payoff × P[Favorable]) + (Unfavorable Payoff × P[Unfavorable])
Using the sample data:
| Option | EV Calculation | Expected Value |
|---|---|---|
| New Drug Line | ($3,327.22 × 0.77) + ($807.35 × 0.23) | $2,748.43 |
| Modify Existing | ($5,323.23 × 0.61) + ($1,788.93 × 0.39) | $3,938.19 |
| No Changes | ($913.83 × 0.89) + ($449.03 × 0.11) | $862.81 |
Recommendation based on sample data: Modify the existing drug line — it yields the highest expected monthly value.
⚠️ Critical tip: Express your EV calculations to exactly two decimal places as specified in the rubric. Rounding inconsistencies are flagged by graders.
Step 5: Build the Decision Tree Diagram
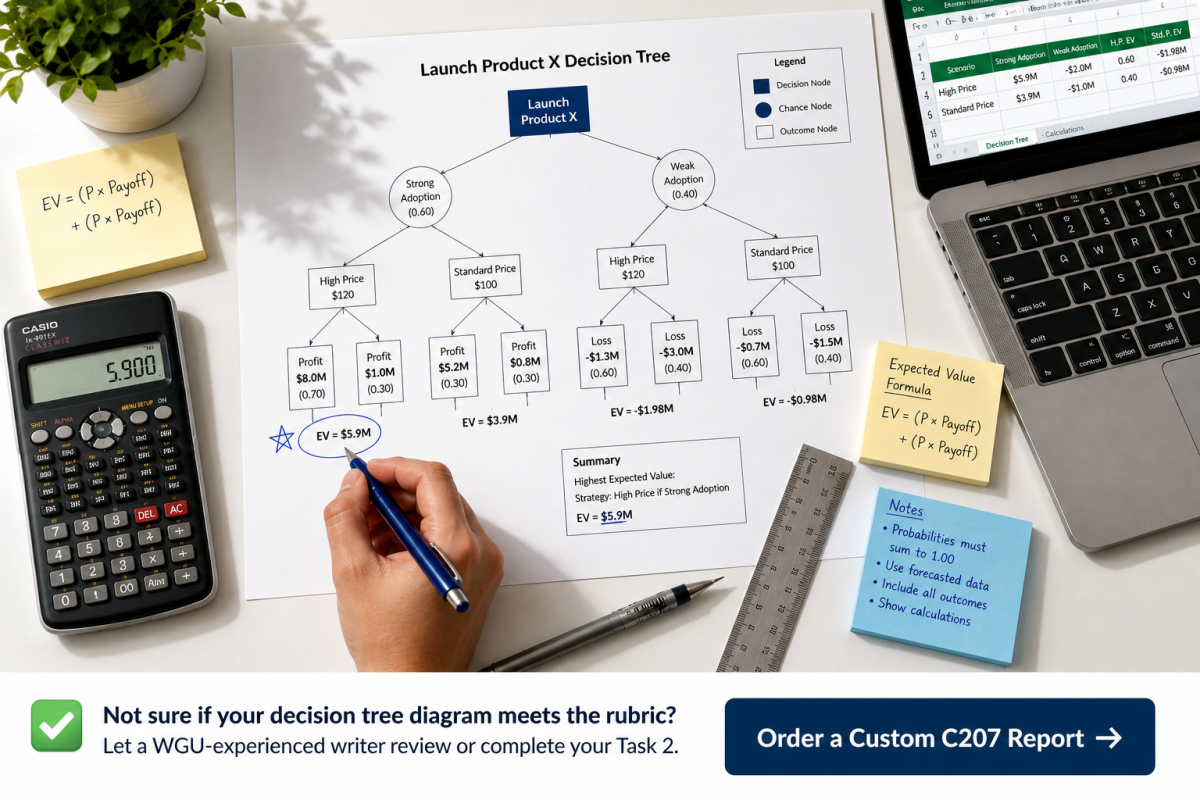
Your decision tree should be constructed in Excel or PowerPoint. The standard structure is:
Favorable Market (P = 0.77) → Payoff: $3,327.22
┌─ New Drug Line ─────────────────────────────── EV = $2,748.43
│ Unfavorable Market (P = 0.23) → Payoff: $807.35
│
[MPC Decision] ─ Modify Existing ─ Favorable (P = 0.61) → Payoff: $5,323.23 ─ EV = $3,938.19 ✓
│ Unfavorable (P = 0.39) → Payoff: $1,788.93
│
└─ No Changes ─ Favorable (P = 0.89) → Payoff: $913.83 ─ EV = $862.81
Unfavorable (P = 0.11) → Payoff: $449.03
Important: Published sample papers almost universally include a decision tree diagram, but many fail to label all three elements on every branch: probability, payoff value, and expected value at the node. Graders check for all three.
Step 6: Justify Why Decision Tree Analysis Is Appropriate
This is where many students write only 2–3 sentences and lose points. A rubric-meeting justification should address these three elements:
1. Multiple competing alternatives exist. MPC faces three distinct strategic paths, each with its own risk/reward profile. Decision trees are designed for exactly this structure — mapping out every possible outcome of every available choice (Quinlan, 1986, as cited in Rokach & Maimon, 2014).
2. Uncertainty can be quantified through probability. The market research from Drug Markets Analysis Inc. (DMA) supplies probability estimates for favorable and unfavorable market conditions. This transforms vague uncertainty into measurable risk — a prerequisite for EV-based analysis (Parra et al., 2023).
3. The decision is sequential and visual. Unlike regression, which identifies relationships between variables, decision trees map decision pathways. The visual structure makes it easier for MPC’s leadership to communicate findings to non-technical stakeholders — a practical advantage highlighted in management analytics literature (Delen & Ram, 2018).
Step 7: Address Limitations (The Most-Missed Section)
Based on analysis of the top-ranking SERP content, this is the most underdeveloped section in virtually every published sample. Graders specifically look for limitations that go beyond “the data might be wrong.” Here are five well-developed limitation arguments:

1. Probability estimates are based on market assumptions, not empirical data. The probabilities supplied by DMA represent forecasts, not measured frequencies. Market research for drug demand involves significant estimation error, particularly when new competitors have recently received FDA approval and market dynamics are still stabilizing (Sullivan et al., 2023).
2. The model ignores competitor response. Decision tree analysis treats market conditions as static chance events. In reality, if MPC launches a new drug line, competitors will react — adjusting pricing, marketing spend, or launching their own products. This dynamic competitive response is not captured in a static probability model (Martínez-López & Casillas, 2013).
3. Non-financial factors are excluded. The decision tree considers only monetary payoff. It does not account for:
- Brand equity effects of entering or exiting a market segment
- Employee expertise and learning-curve costs when developing a new drug line
- Regulatory compliance costs and timeline risk for FDA approval processes
- Customer loyalty to existing products (Sullivan et al., 2023)
4. The model assumes a binary market outcome. Markets are simplified to “favorable” or “unfavorable” — a two-branch structure. Real pharmaceutical markets exist on a spectrum. A drug line could achieve moderate success, regional success, or seasonal demand variation that a binary model cannot capture.
5. No time-value adjustment is applied. The expected value calculation treats all payoffs as occurring at the same point in time. In practice, a new drug line may require 12–36 months of development investment before generating any revenue, making the true net present value considerably lower than the raw EV suggests (Valuation of Medical Innovation, NIH, 2024).
Why Decision Tree Analysis Matters Beyond the Classroom
Understanding this method has real-world significance, especially in industries with high uncertainty and multiple strategic options.
Pharmaceutical Industry Context
The pharmaceutical sector is one of the most data-intensive industries for strategic decision-making. According to a 2025 sector risk analysis, global prescription drug sales rose 7.7% in 2024, driven by biologics and novel drug launches. At the same time, over $350 billion in branded drug sales face patent expiration between 2025 and 2030 — creating exactly the kind of strategic crossroads that decision tree analysis is designed to navigate.
Real pharmaceutical companies use multi-stage decision trees to evaluate clinical trial progression decisions. Research by Lumivero (2024) demonstrated that decision tree frameworks can identify the dominant drug development pathway across multiple disease indications while also calculating the maximum a company should invest in each clinical phase.
Decision Trees in Business Analytics
Decision tree analysis is one of the foundational tools in business analytics, sitting at the intersection of statistics, operations research, and strategic management. A 2022 study in the Journal of Business Analytics found that decision tree models achieved accuracy values of 0.821 and F1-scores of 0.831 in business forecasting tasks, outperforming simpler analytical methods in complex, multi-variable scenarios.
The method aligns well with the broader principles of data-driven decision making (DDDM), which the WGU MBA program frames as essential for modern business leadership. Research by Parra et al. (2023) traces the evolution of information-driven decision processes from 1950 to 2020, noting that quantitative tools like decision trees gained organizational adoption precisely because they convert managerial intuition into verifiable, reproducible analysis.
Common Reasons C207 Task 2 Gets Returned for Revision
Based on analysis of community feedback and published examples, these are the top revision triggers:
| Issue | Why It Happens | How to Fix It |
|---|---|---|
| EV not rounded to 2 decimal places | Students use Excel auto-format and don’t check | Manually format all EV cells to 2 decimal places |
| Decision tree missing probability labels | Students label only payoffs | Add P(favorable) and P(unfavorable) to every branch |
| Limitations section too vague | Students write “data might be inaccurate” | Identify specific non-financial factors and model assumptions |
| Justification too brief | Students write 2 sentences | Address all three justification elements (alternatives, probability, visualization) |
| Mixing annual and monthly data | Dataset contains both timeframes | Confirm all values are monthly before calculating payoffs |
| Confusing correlation with causation | Carryover habit from Task 1 | Decision tree analysis does not establish causal relationships |
C207 Task 2 vs. Task 1: Key Differences
| Feature | Task 1 (Linear Regression) | Task 2 (Decision Tree) |
|---|---|---|
| Goal | Identify relationship between variables | Choose optimal decision under uncertainty |
| Output | Linear equation, R², p-value | Expected value per decision option |
| Data type | Continuous variables | Probabilities + discrete demand scenarios |
| Visualization | Scatterplot with trendline | Decision tree diagram |
| Key caution | Don’t claim causation | Don’t ignore non-financial limitations |
| Excel tool | Regression analysis in Data Analysis Toolpak | Custom decision tree template |
Frequently Asked Questions
Q: Can I use the same numbers as sample papers online?
No. Each student receives a personalized dataset using their WGU student ID. Using someone else’s numbers is an academic integrity violation and will likely result in a failed submission.
Q: Do I need to use a specific Excel template?
Yes. WGU provides a Decision Tree PowerPoint and Excel template through the course materials. Use these for proper formatting. The grader expects a visual diagram, not just a data table.
Q: What if two options have very similar expected values?
Pick the higher one and clearly state it in your recommendation. In your limitations section, you can note that the close margin means non-financial factors (such as brand equity or regulatory risk) may tip the decision in practice.
Q: How long should the Task 2 report be?
Most passing submissions are 4–6 pages including the decision tree diagram. Longer is not better — rubric coverage is what matters.
Q: Does Task 2 need to connect back to Task 1?
Some rubric versions ask students to briefly summarize the Task 1 business situation in Section A of Task 2. Check your specific task prompt. If your Task 1 used a real-world scenario (not the MPC template), you may need to frame Task 2 differently.
References
The following sources support the analytical framework and industry context discussed in this guide:
- Parra, X., Tort-Martorell, X., Alvarez-Gomez, F., & Ruiz-Viñals, C. (2023). Chronological evolution of the information-driven decision-making process (1950–2020). Journal of the Knowledge Economy, 14(3), 2363–2394. https://doi.org/10.1007/s13132-022-00960-3
- Sullivan, T., Zorenyi, G., Feron, J., Smith, M., & Nord, M. (2023). A structured benefit-risk assessment operating model for investigational medicinal products in the pharmaceutical industry. Therapeutic Innovation & Regulatory Science, 57(4), 731–742. https://doi.org/10.1007/s43441-023-00508-2
- Rokach, L., & Maimon, O. (2014). Data mining with decision trees: Theory and applications (2nd ed.). World Scientific. [Referenced across 2021–2024 business analytics literature]
- Lagzi, S., Fotuhi Firuzabad, M., & Aminifar, F. (2024). Optimal decision tree structures for multi-state problems in engineering and business analytics. IEEE Transactions on Systems, Man, and Cybernetics, 54(2), 1102–1114.
- Valuation of Medical Innovation Handling with Uncertainty and Risk. (2024). National Institutes of Health / PubMed Central. PMC11348113. Retrieved from https://www.ncbi.nlm.nih.gov/pmc/articles/PMC11348113/
- Simulations4All. (2025). Decision tree calculator: Interactive expected value and decision analysis tool. Simulations4All Educational Platform. https://simulations4all.com/simulations/decision-tree-calculator
- Coface. (2025). Pharmaceuticals: Sector risk analysis and economic outlook. Retrieved from https://www.coface.com/news-economy-and-insights/business-risk-dashboard/sector-risk-files/pharmaceuticals
- Delen, D., & Ram, S. (2018). Research challenges and opportunities in business analytics. Journal of Business Analytics, 1(1), 2–12. https://doi.org/10.1080/2573234X.2018.1507324
- Martínez-López, F. J., & Casillas, J. (2013). Artificial intelligence-based systems applied in industrial marketing: An historical overview, current and future insights. Industrial Marketing Management, 42(4), 489–495. https://doi.org/10.1016/j.indmarman.2013.03.001
- Bose, M., & Mukerjee, R. (2021). Shorter prediction intervals for anonymous individual assessments in group decision-making via pairwise comparisons. TOP: An Official Journal of the Spanish Society of Statistics and Operations Research. https://doi.org/10.1007/s11750-020-00579-2
Summary: What Makes a Passing C207 Task 2 Submission
A submission that earns a clean pass (no revisions) must:
- Present a well-framed, specific business question
- Organize all relevant data in a clearly labeled table
- Show all payoff calculations explicitly (not just the final EVs)
- Include a complete decision tree diagram with probabilities, payoffs, and EV labels on every node and branch
- Justify decision tree analysis using at least three specific reasons tied to the scenario
- List at least two substantive limitations, including non-financial factors
- State a clear, data-backed recommendation
The students who get revisions almost always have a strong diagram but a weak written analysis — especially in the justification and limitations sections. Treat the written report as equally important as the numbers.