
Blog
WGU C219 Task 1: Investor Presentation Guide + Example (C219 Healthcare Management Capstone)


Updated on: Aug 24, 2026
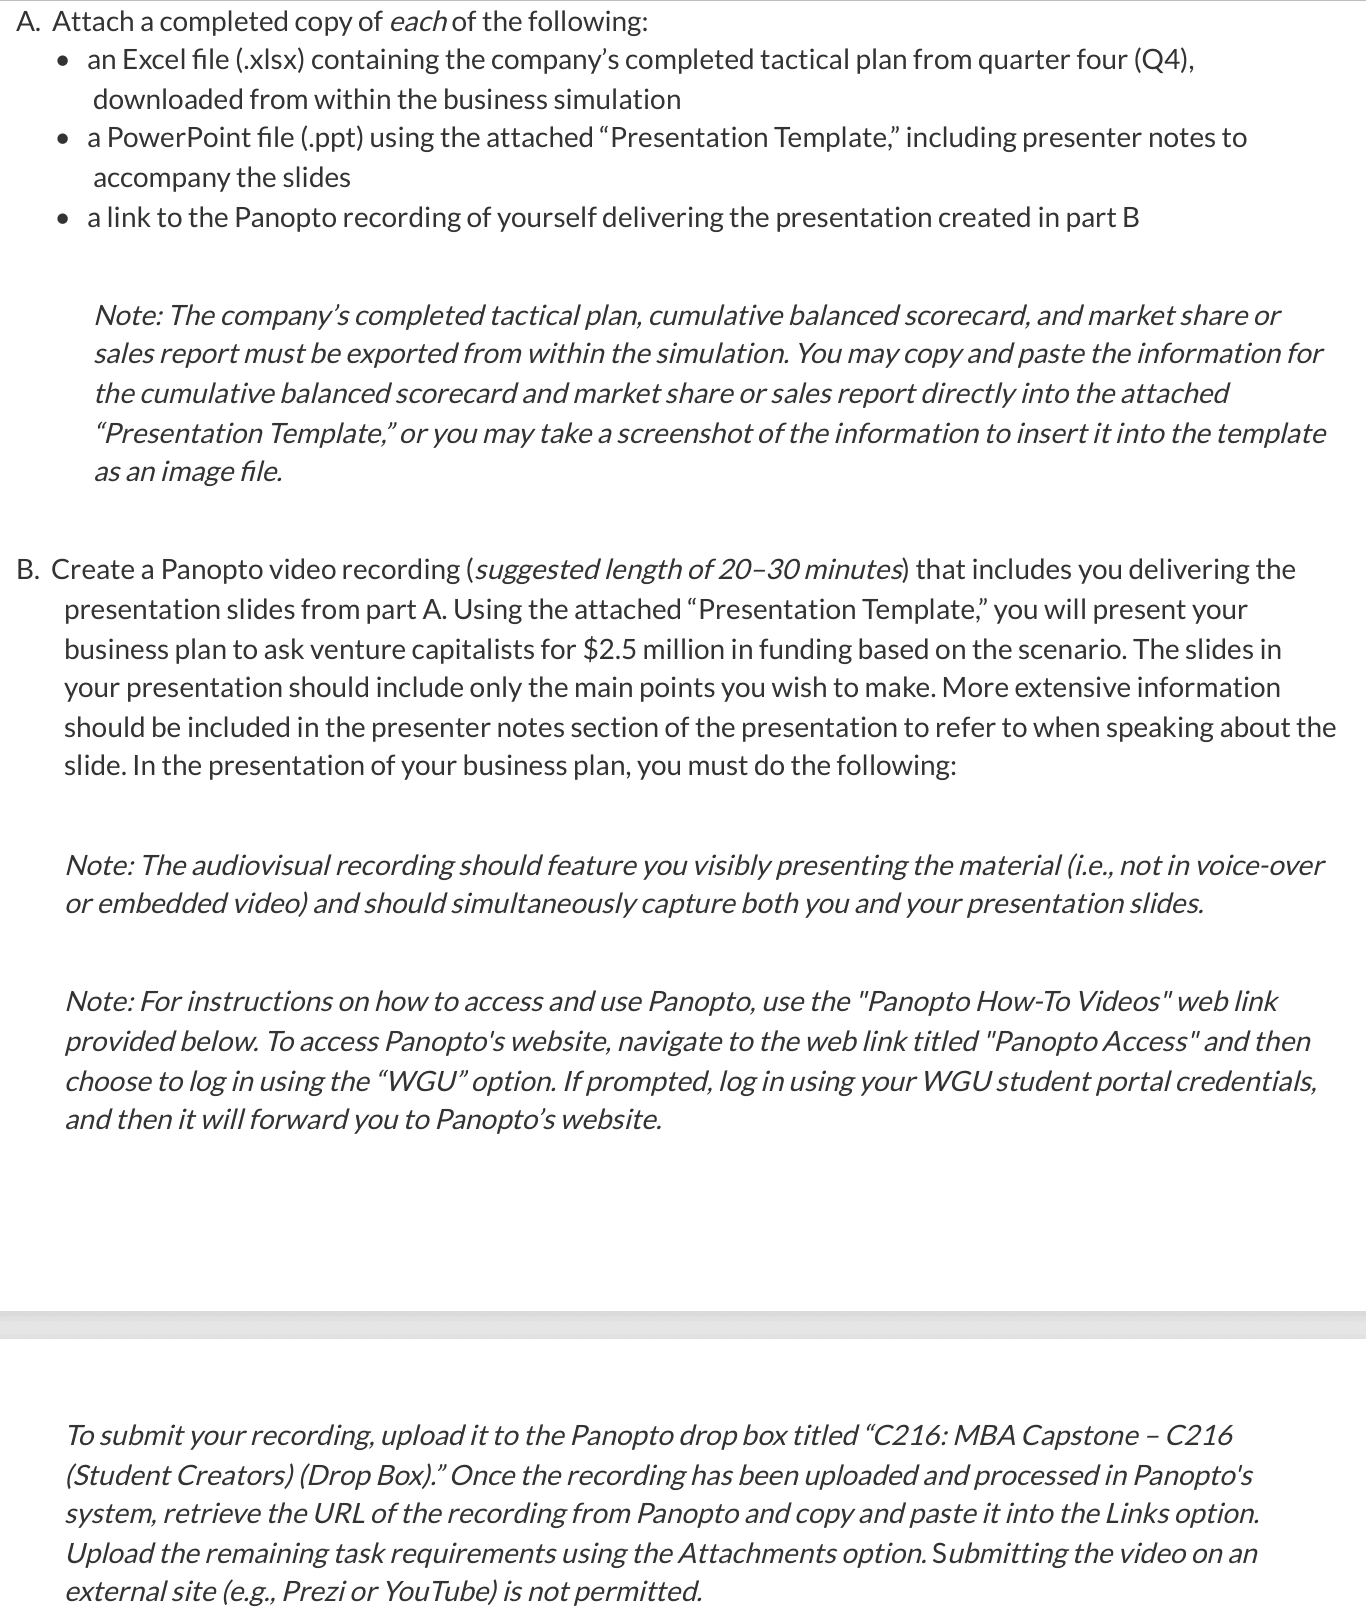
WGU C219 Task 1 is the first performance assessment in the C219 Healthcare Management Capstone (KAM4). You step into the role of a startup founder pitching for $2.5 million in equity funding from venture capitalists, using three completed quarters of Marketplace simulation data. The deliverable is a WGU C219 Task 1 PowerPoint presentation recorded on Panopto, with a completed Tactical Plan Excel file attached.
This guide gives you everything you need to pass C219 Task 1 on the first attempt: a slide-by-slide structure mapped to the rubric, worked financial and market share examples, a complete SWOT analysis, all five required strategies, implementation steps, and Panopto tips. If you are also looking for C219 Task 1 answers to specific rubric sections or C219 Task 1 examples you can study before writing, both are covered below.
Also see: WGU C219 Task 2 (stockholder report) and WGU C219 Task 3 (career reflection).
C219 Task 1 Assignment: Investor Presentation
Introduction
An important aspect of running a successful start-up business is acquiring funding from potential investors based on information about the business. In this task, you will use the skills you have acquired in the MBA coursework to complete the start-up phase in a business simulation. The simulation is accessed through your course. Using data from the Q1–Q4 phase of the simulation, you will create and deliver a presentation for potential business investors using the attached “Presentation Template” PowerPoint slide deck and information from the scenario. The objective of the presentation is to obtain capital to grow your business.
Before you begin working on Task 1, you must finish and submit the simulation up to the end of the third quarter (Q3). Begin working through the fourth quarter (Q4) and load the data from the simulation into the tactical plan. Next, manually fill out your projections for the fifth (Q5) and sixth quarters (Q6) within the tactical plan, ensuring the tactical plan is fully updated through Q6 before beginning this task.
Submit Task 1 concurrently with submitting your decisions for Q4 within the simulation. When you have passed Task 1, submit Q4 again and you will be allowed to proceed with the simulation into Q5.
Scenario
You are the owner of a start-up business that creates 3D-printed, carbon fiber bicycles. Up through the business’s third quarter (Q3), you have used your own money to fund the business. The business model shows promise, but you are now seeking an additional $2.5 million in equity funding to execute your business plan. You will create and deliver a multimedia presentation that shows your business plan to potential investors and illustrates how the additional funding will be used and will provide a return to your investors.
Requirements
Your submission must represent your original work and understanding of the course material. Most performance assessment submissions are automatically scanned through the WGU similarity checker.
Students are strongly encouraged to wait for the similarity report to generate after uploading their work and then review it to ensure Academic Authenticity guidelines are met before submitting the file for evaluation. See Understanding Similarity Reports for more information.
Grammarly Note:
Professional Communication will be automatically assessed through Grammarly for Education in most performance assessments before a student submits work for evaluation. Students are strongly encouraged to review the Grammarly for Education feedback prior to submitting work for evaluation, as the overall submission will not pass without this aspect passing. See Use Grammarly for Education Effectively for more information.
Microsoft Files Note:
Write your paper in Microsoft Word (.doc or .docx) unless another Microsoft product, or pdf, is specified in the task directions. Tasks may notbe submitted as cloud links, such as links to Google Docs, Google Slides, OneDrive, etc. All supporting documentation, such as screenshots and proof of experience, should be collected in a pdf file and submitted separately from the main file. For more information, please see Computer System and Technology Requirements.
C219 Task 1 Rubric at a Glance
Before opening PowerPoint, read every criterion at the Competent level and ask: “What specific simulation data proves I meet this standard?” Build your outline around those answers.
| Section | What Is Required | Key Check |
|---|---|---|
| B1a | 2 specific sales decisions + market share impact | Data from market share or sales report |
| B1b | 2 specific financial decisions + income statement impact | Financial summary table must be complete and accurate |
| B2 | Complete 2×2 SWOT table | No blank quadrants |
| B2a | Internal factors only (strengths and weaknesses) | Each item tied to simulation data |
| B2b | External factors only (opportunities and threats) | Each item tied to SWOT table entries |
| B3 | All five strategies: Marketing, Sales Channel, HR, Manufacturing, Financial | Rationale tied to Q1-Q3 data |
| B3a | Two anticipated benefits from your strategy set | Grounded in your specific strategies |
| B4 | 2 strategies x 2 specific steps = 4 total implementation actions | Must reference Q4, Q5, or Q6 decisions |
| C | In-text citations + reference list | APA 7 format |
| D | Professional communication | Pass Grammarly before submitting |
Required Deliverables for C219 Capstone Task 1
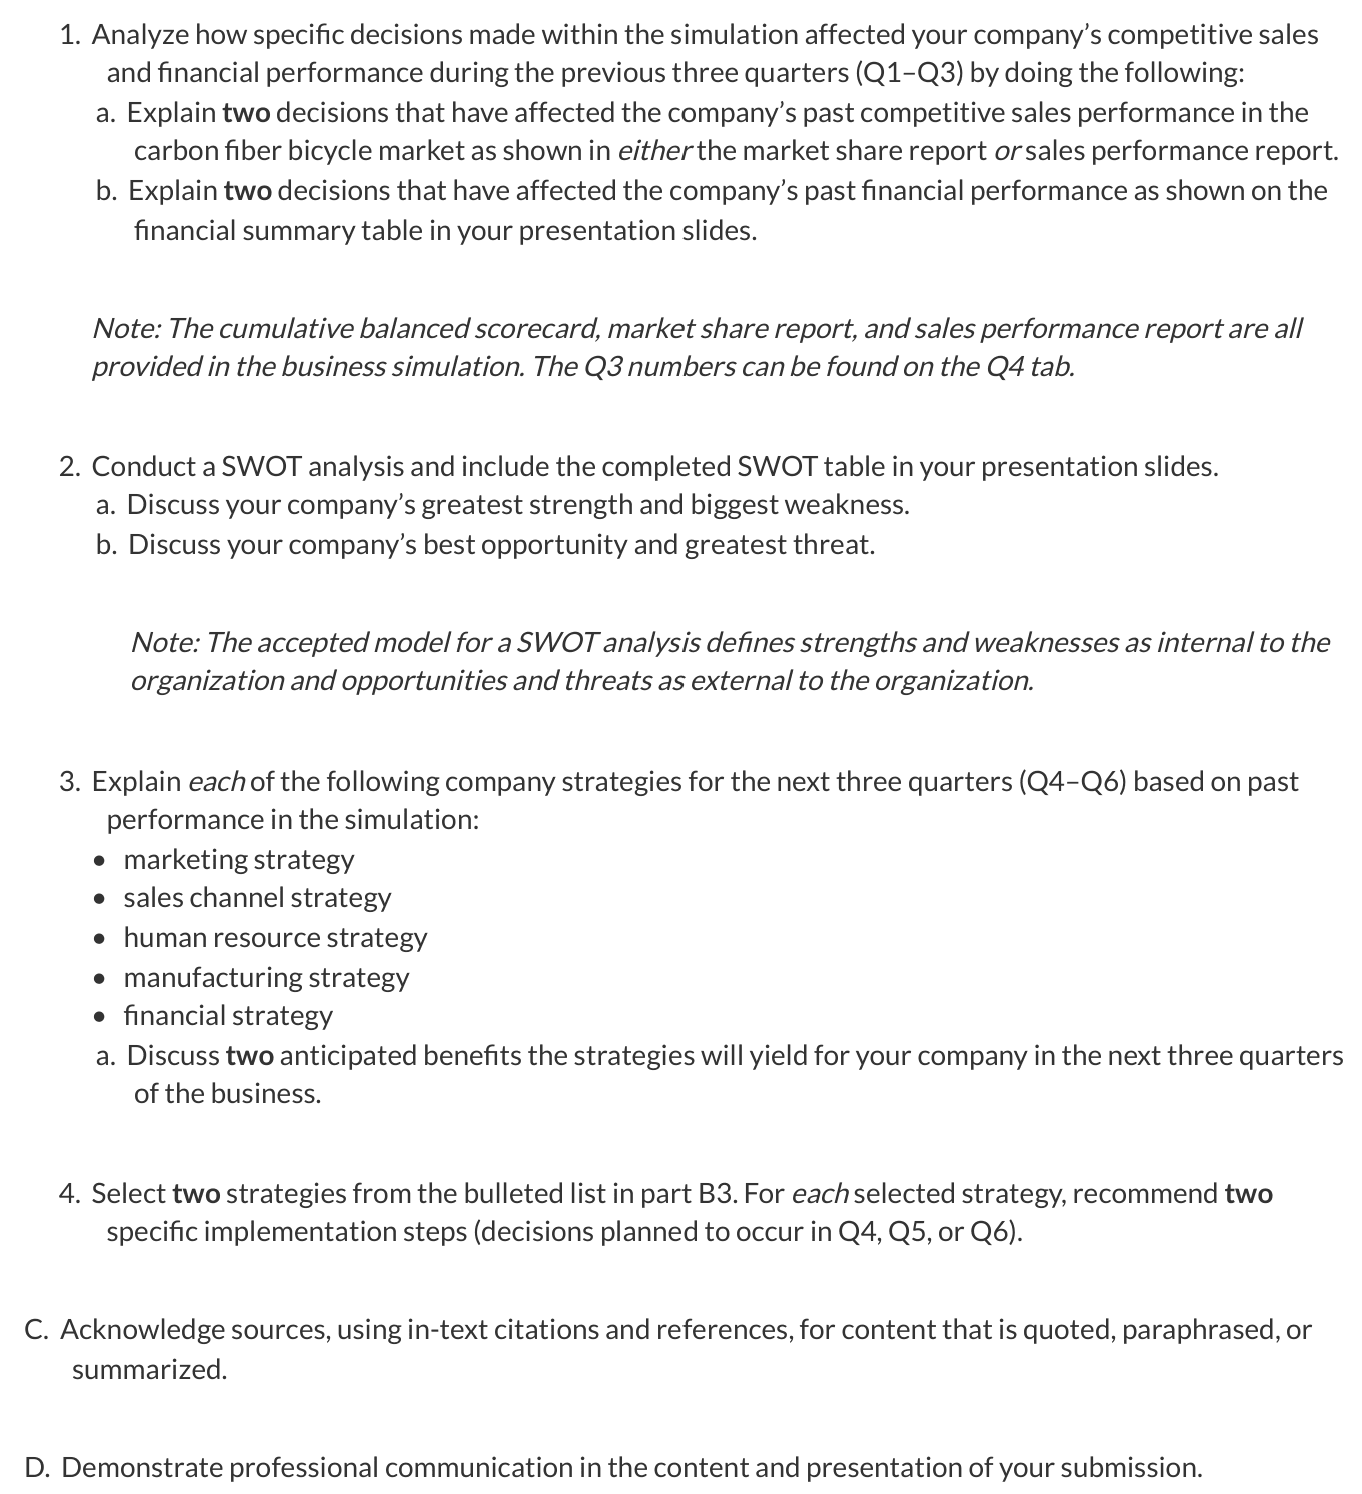
Four items must be submitted together:
- PowerPoint file (.pptx) using WGU’s official Presentation Template, with detailed presenter notes on every substantive slide
- Tactical Plan Excel file (.xlsx) exported directly from the Marketplace simulation after completing Q4. No manually created spreadsheets.
- Panopto recording (20-30 minutes) of you visibly on camera presenting your slides simultaneously
- Panopto URL pasted into the Links field of your submission
Download the official files:
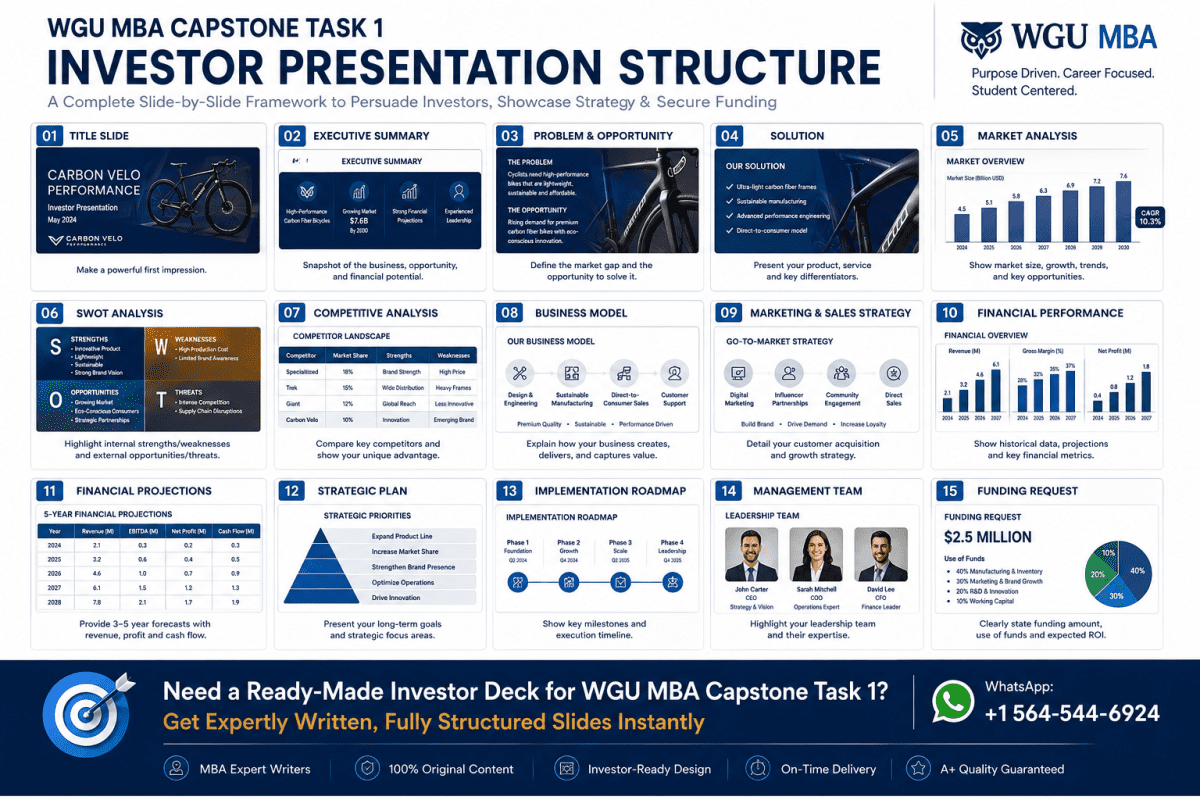
Slide-by-Slide Structure for the WGU C219 Task 1 PowerPoint
The following structure covers every rubric criterion. Do not skip or merge sections.
| Slide | Title | What to Include |
|---|---|---|
| 1 | Title Slide | Company name, your name, date, funding ask ($2.5M) |
| 2 | Company Overview | Business model, product line, value proposition |
| 3 | Funding Request | How $2.5M will be deployed; expected ROI |
| 4 | Competitive Sales Performance | Q1-Q3 sales decisions and market share impact (B1a) |
| 5 | Financial Performance | Financial summary table: Revenue, Gross Profit, Net Income Q1-Q3 (B1b) |
| 6 | SWOT Analysis Table | Complete 2×2 SWOT (B2) |
| 7 | Strength and Weakness | Greatest strength + biggest weakness with simulation data (B2a) |
| 8 | Opportunity and Threat | Best opportunity + greatest threat with external framing (B2b) |
| 9 | Marketing Strategy | Q4-Q6 brand positioning, pricing, advertising approach (B3) |
| 10 | Sales Channel Strategy | Direct vs. indirect channels, territory plan (B3) |
| 11 | Human Resource Strategy | Hiring plan, compensation, productivity goals (B3) |
| 12 | Manufacturing Strategy | Capacity, COGS reduction, quality targets (B3) |
| 13 | Financial Strategy | Revenue targets, cost controls, capital allocation (B3) |
| 14 | Anticipated Benefits | Two strongest outcomes from your strategy set (B3a) |
| 15 | Implementation Steps | Specific Q4/Q5/Q6 actions for 2 chosen strategies (B4) |
| 16 | Conclusion / Investor Ask | Summary, ROI case, call to action |
| 17 | References | APA 7 citations |
C219 Task 1 Financial Summary: Q1-Q3 Simulation Data
Your financial summary table must come from your simulation exports, not estimates. Below is a worked C219 Task 1 example using the BAISKELI simulation run:
| Metric | Q1 | Q2 | Q3 |
|---|---|---|---|
| Revenue | $0 | $276,820 | $308,470 |
| Gross Profit | $0 | $175,764 | $228,889 |
| Gross Margin % | n/a | 63.5% | 74.2% |
| R&D Expense | $90,000 | $60,000 | $60,000 |
| Net Fixed Assets | $480,000 | $940,000 | $1,380,000 |
| Total Assets | $1,214,500 | $1,423,626 | $1,480,001 |
| Cash Balance | $434,500 | $183,626 | $1 |
Three trends to highlight in your B1b analysis:
- Gross margin improved from 63.5% (Q2) to 74.2% (Q3), driven by production efficiency gains. This signals improving unit economics as the company scales.
- Revenue grew 11.4% quarter-over-quarter from Q2 to Q3 despite a standing start in Q1.
- Cash fell to $1 by end of Q3. This is the central argument for the $2.5M equity raise. Frame it as evidence that all founding capital has been deployed into productive assets ($1.38M in net fixed assets), not as a failure.
Competitive Sales Performance: Q1-Q3 Market Share
For B1a, reference your market share report directly. Here is the Q3 breakdown for the BAISKELI example:
| Company | Recreation | Mountain | Speed |
|---|---|---|---|
| BAISKELI (ours) | 8.20% | 24.02% | 0% |
| The Good Bike | 1.02% | 19.65% | 17.68% |
| Thunder Bike | 29.62% | 0% | 38.37% |
| BIK3D | 25.49% | 56.33% | 0% |
| Back to Bike | 35.67% | 0% | 43.95% |
Two B1a sales decisions to analyze:
Decision 1: Multi-segment product line launch. The decision to launch across Recreation and Mountain rather than one segment increased total units sold and diversified revenue. In Q3, the company fulfilled 255 units across segments with zero stockouts.
Decision 2: Manufacturing capacity investment. Investing $480K in Q1 growing to $1.38M by Q3 expanded production and reduced per-unit COGS, driving gross margin from 63.5% to 74.2%. This improved competitive positioning on margin even as rivals competed on price.
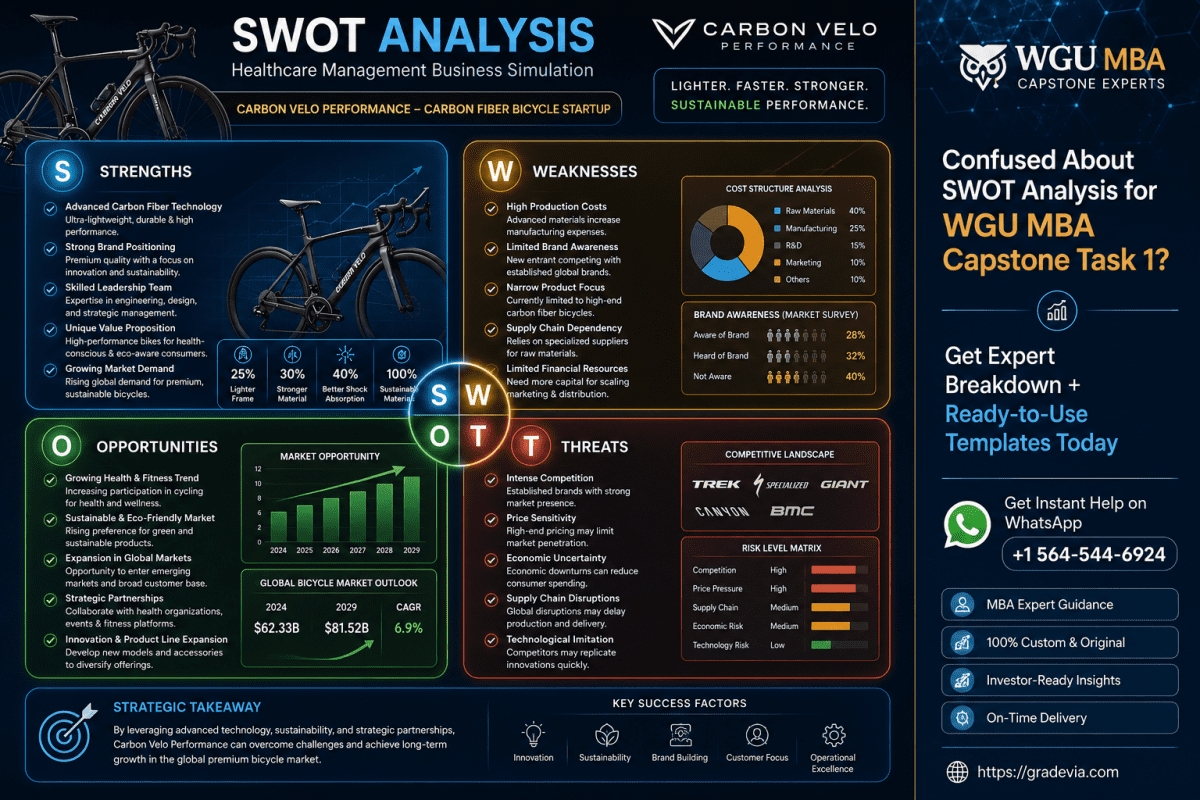
WGU C219 Capstone Task 1: SWOT Analysis Example
Critical rule before filling in any SWOT quadrant: strengths and weaknesses describe your company (internal). Opportunities and threats describe the market and competitors (external). Mixing these up is the single most common B2 revision trigger.
| STRENGTHS (Internal) | WEAKNESSES (Internal) |
|---|---|
| Gross margin improved 63.5% to 74.2% across Q2-Q3 | Near-zero cash balance ($1) at end of Q3 |
| Zero stockouts in Q3; full demand fulfillment across 7 SKUs | No Speed segment presence despite 967 units of market demand |
| Revenue growth from $276,820 (Q2) to $308,470 (Q3) | High R&D spend ($60K/quarter) requires new capital to sustain |
| Proven 3D printing and carbon fiber manufacturing capability | Only 7.98% total market share; ranked 4th of 5 competitors |
| OPPORTUNITIES (External) | THREATS (External) |
|---|---|
| Speed segment: 967 total units demanded in Q3; BAISKELI has zero share | Back to Bike holds 33.06% total share and competes in Recreation and Speed |
| $2.5M equity raise enables capacity and marketing expansion | BIK3D holds 56.33% of Mountain; entrenched competitor in our strongest segment |
| Mountain segment: only 2 active competitors with 458 total units | Price-cutting by competitors could compress margins in Recreation |
| Growing consumer demand for premium, sustainable cycling products | Market demand (3,194 units in Q3) is finite and competitive |
Greatest Strength: Improving Gross Margin
Gross margin grew from 63.5% to 74.2% in a single quarter while the company expanded its product portfolio to 7 SKUs. The BK Plus brand drove $125,615 in Q3 revenue, demonstrating market responsiveness to the flagship product. This validates unit economics before the equity raise.
Biggest Weakness: Cash Depletion
$1 in cash against $1.48M in total assets means all value is locked in fixed assets. Any Q4 revenue disruption without new capital halts operations. This is simultaneously your strongest investor argument: every dollar of founding capital has been deployed productively.
Best Opportunity: Speed Segment Entry
Speed accounts for 30.3% of total market volume (967 of 3,194 Q3 units) and BAISKELI has zero presence. Competitors Thunder Bike (38.4%) and Back to Bike (44.0%) have proven the demand. A Q4 product launch funded by the equity raise is the highest-potential growth move available.
Greatest Threat: Back to Bike
Back to Bike holds 33.06% total share, is active in both Recreation and Speed, and pulled 1,056 total units in Q3. Any segment BAISKELI enters, expect a response from this competitor. Differentiation through carbon fiber performance specs is the primary mitigation.
All Five Required C219 WGU Task 1 Strategies (B3)
Every strategy must be grounded in Q1-Q3 simulation data. Strategies described without rationale are the top reason B3 gets returned.
Marketing Strategy
Increase advertising in Recreation and Speed in Q4, where the largest unit volumes exist. Price the new Speed SKU competitively versus Thunder Bike and Back to Bike to drive trial. Deploy digital-first campaign targeting enthusiast cyclists.
Rationale: Q3 shows 1,769 Recreation units and 967 Speed units across all competitors. BAISKELI’s 8.2% Recreation share and 0% Speed share confirm marketing investment has clear headroom to convert.
Sales Channel Strategy
Concentrate on direct and specialty retail channels in Q4 where premium buyers shop. Add a regional distribution agreement in Q5 targeting high-income markets where carbon fiber bicycles command premium pricing.
Rationale: Average unit pricing ($1,050-$1,400) aligns with specialty retail and direct channels. Back to Bike’s Recreation dominance signals brick-and-mortar presence is necessary for competitive parity.
Human Resource Strategy
In Q4, hire three production technicians to support capacity expansion. Implement skill-based pay tied to quality metrics. In Q5, add a sales representative for the Speed segment launch. In Q6, develop a formal onboarding program as the workforce scales.
Rationale: Net fixed assets grew from $480K to $1.38M across three quarters. Human capital must scale proportionally to leverage that equipment investment.
Manufacturing Strategy
In Q4, deploy $1.2M to add two additional 3D printers, reducing per-unit production time and cost. Target gross margin above 78% by Q6. Implement a lean manufacturing review in Q5. Add quality inspection tooling in Q6 to protect brand reputation.
Rationale: The Q2-Q3 gross margin improvement demonstrates that manufacturing efficiency investments directly improve profitability. The trajectory must continue to reach investor-attractive returns.
Financial Strategy
Allocate the $2.5M as follows: $1.2M to manufacturing capacity, $600K to marketing and sales channel development, $400K to Speed segment product development, $300K retained as operating cash reserve. Revenue targets: $450K in Q4, $600K in Q5, $800K in Q6. EBITDA-positive by Q5, positive net income by Q6.
Rationale: The 74.2% Q3 gross margin validates unit economics at scale. The depletion to $1 cash proves self-funding is no longer possible. This is a calculated deployment into proven opportunity, not a rescue.
Two Anticipated Benefits (B3a)
Benefit 1: Revenue scale through Speed segment entry. Capturing 10% of Speed demand (approximately 97 units) at average pricing of $1,200-$1,400 would add $116,000-$136,000 in quarterly revenue, directly accelerating the path to profitability.
Benefit 2: Operational cost efficiency through manufacturing investment. Continuing the Q2-Q3 margin improvement trajectory of approximately 5 percentage points per quarter, BAISKELI can target 83-85% gross margins by Q6, creating significant operating leverage for investors.
Implementation Steps for B4
Choose two strategies from B3 and write two specific steps for each (four total). Each step must name the quarter, the resource or dollar amount, and the expected outcome. Generic steps fail B4.
Marketing Strategy: Two Steps
Q4 Step: Allocate $25,000 to a digital advertising campaign targeting the 25-45 demographic in high-cycling-index markets. Target 15% increase in Recreation segment demand from BAISKELI brands (baseline: 145 units in Q3).
Q5 Step: Launch BAISKELI Speed 1 at $1,195, supported by $40,000 in launch marketing. Set a Q5 target of 75-90 Speed units, representing approximately 8-9% of the 967-unit Q3 Speed market.
Financial Strategy: Two Steps
Q4 Step: Deploy $1.2M toward manufacturing capacity expansion: two additional 3D printing units and upgraded carbon fiber filament processing. Projected COGS reduction of 3-5 percentage points by Q5.
Q5/Q6 Step: Set Q5 EBITDA target of $50,000 and Q6 net income target of $25,000. Produce monthly financial dashboards tracking revenue growth, COGS reduction, and cash position against the equity deployment schedule.
Presenter Notes for C219 Task 1: What the Rubric Requires
The rubric states: “more extensive information should be included in the presenter notes section.” This is not optional. Evaluators read presenter notes as part of the assessment. Slides with missing or minimal notes are a common revision trigger.
What to include per slide:
- Full explanation of every data point on the slide
- Why it matters to an investor
- Context or nuance the visual does not capture
- Transition to the next slide
- APA citations where data or claims require sourcing
Minimum benchmark: 150-300 words per substantive slide. Strategy, SWOT, and financial analysis slides should run longer.
Sample presenter notes for the SWOT slide:
“This slide presents BAISKELI’s Q3 SWOT analysis. Starting with strengths: gross margin improved from 63.5% to 74.2% in a single quarter while the company expanded to 7 SKUs and fulfilled 100% of demand with zero stockouts. These are not soft indicators. They reflect manufacturing discipline and product-market fit before a single external dollar has been invested. Our critical weakness is equally clear: $1 in cash. Every dollar of founding capital is deployed into $1.38M in net fixed assets. Asset-rich, cash-constrained. That constraint is why we are in this room. The Speed segment opportunity is the most significant: 967 total units demanded in Q3, zero share for BAISKELI. With capital, we enter in Q4. The primary external threat is Back to Bike: 33% total share, active in both Recreation and Speed, 1,056 units in Q3 alone. Any move we make, expect a competitive response. Our differentiation through 3D-printed carbon fiber is the performance advantage that mass-market competitors cannot quickly replicate.”
Common presenter notes mistakes:
- One-line notes (“This slide covers the SWOT”) will trigger revision
- Repeating slide text verbatim instead of expanding on it
- Missing transitions between slides
- No investor-facing framing for the data
Panopto Recording Tips for the C219 WGU Task 1 Presentation
- Record in a quiet room with good lighting. Natural light facing you works better than overhead.
- Use a headset or USB microphone. Built-in laptop microphones pick up background noise.
- Test a 2-minute practice run before recording the full presentation to verify audio and video capture.
- Confirm Panopto captures both your camera feed and your slides simultaneously before recording.
- Speak at a measured pace. Vary tone to avoid monotony. Pause briefly between major sections.
- Upload to the correct Panopto folder: “C216: MBA Capstone, C216 (Student Creators) (Drop Box).”
- Set sharing permissions so WGU evaluators can view the recording.
- Paste the Panopto URL into the Links field of your submission. Do not forget this step.
You may read from your presenter notes during recording. WGU does not prohibit this. The requirements are: be visibly present on camera throughout, show slides simultaneously, and maintain a professional delivery pace.
Common Reasons C219 Capstone Task 1 Gets Returned
- Strategies without rationale. “Increase advertising” does not pass. You must cite Q1-Q3 data and explain what outcome you expect.
- Missing simulation evidence in B1a and B1b. Revenue figures, market share percentages, and gross margins from your actual reports must appear in the presentation.
- SWOT quadrant errors. External market conditions listed as weaknesses. Internal goals listed as opportunities. Every SWOT item must be traceable to a data point.
- Thin or missing presenter notes. If your notes are one line per slide, expect a revision request.
- Generic implementation steps. “Expand production” fails B4. Name the quarter, the dollar amount, and the target outcome.
- Grammarly errors. WGU uses Grammarly for Education automatically. Pervasive grammar or spelling errors fail Criterion D. Run all slide text and presenter notes through Grammarly before submitting.
Frequently Asked Questions About WGU C219 Task 1
What is WGU C219 Task 1?
C219 Task 1 is the first performance assessment in the C219 Healthcare Management Capstone (also called KAM4 or C219 WGU Task 1). You play a startup founder pitching for $2.5M in equity funding using three quarters of Marketplace simulation data. The deliverable is a recorded WGU C219 Task 1 PowerPoint presentation with a Tactical Plan Excel export.
How long should the Panopto recording be?
20-30 minutes. Submissions under 20 minutes are almost always too thin. Aim for approximately 1.5-2 minutes per slide.
How many slides does C219 Task 1 need?
No stated minimum or maximum, but a complete rubric-aligned submission typically runs 15-20 slides following the official Presentation Template structure.
Can I get a C219 Task 1 PDF of my completed submission?
Yes. WGU accepts submissions as PDF or Word document. Export your PowerPoint to PDF if that is your preferred format, but ensure the file includes presenter notes in the PDF export (use “Print to PDF” with “Notes Pages” layout in PowerPoint).
Is C219 Task 1 harder than C219 Task 2 or C219 Task 3?
Most students find C219 Task 2 more analytically demanding (it covers all eight quarters with a Balanced Scorecard and competitive benchmarking). C219 WGU Task 1 is typically the most technically complex deliverable because of the Panopto recording requirement on top of the slide build. C219 Task 3 is the most personal and usually the fastest to complete. See the C219 Task 2 WGU guide and C219 Task 3 guide for full breakdowns.
Do presenter notes count toward my grade?
Yes. The rubric explicitly requires detailed presenter notes. Evaluators read them. Slides with missing or one-line notes are a direct path to a revision request.
Why does WGU C219 Task 1 get returned?
The four most common causes: strategies described without Q1-Q3 data rationale; SWOT entries mixing internal and external factors; presenter notes that are too thin; and implementation steps that are too generic. See the revision triggers section above for specifics.
References
- Western Governors University. (2024). KAM4 Task 1: Investor presentation [Course assessment]. WGU C219 MBA Healthcare Management Capstone.
- Wheelen, T. L., Hunger, J. D., Hoffman, A. N., & Bamford, C. E. (2022). Strategic management and business policy: Globalization, innovation, and sustainability (15th ed.). Pearson.
- Hill, C. W. L., Jones, G. R., & Schilling, M. A. (2021). Strategic management: Theory and cases: An integrated approach (13th ed.). Cengage Learning.
- Rothaermel, F. T. (2023). Strategic management (5th ed.). McGraw-Hill Education.
- Marketplace Simulations. (2024). Business simulation: Carbon fiber bicycle industry. Marketplace Live.