
Blog
How to Write a Null Hypothesis for WGU C207 Task 1 (QUM3 Linear Regression)


Updated on: Oct 19, 2026
By Dan Palmer, MBA · Academic strategy consultant for working adult learners · LinkedIn
WGU C207 Task 1, listed on your directions as QUM3 Task 1: Linear Regression Analysis, asks you to analyze a business scenario and dataset generated from your student ID. Part A2 is one line long: “State the null hypothesis for this linear regression analysis.” It’s also the line the rest of the report depends on. Your A3 justification has to use it, and your D1b interpretation has to answer it.
Working adults in Data-Driven Decision Making usually understand the business side of their scenario quickly. Where they lose time is the statistical wording: a null hypothesis that describes a difference instead of a relationship, says “proves,” or never names the variables. This page shows how to write the null hypothesis for WGU C207 linear regression in words and symbols, how to handle more than one independent variable, and how to carry it through to your decision in Part D. It ends with a worked example built on fictitious data, with Excel output and a scatter plot.
Where the Null Hypothesis Shows Up in QUM3 Task 1
| Prompt | What it asks | How the null hypothesis connects |
|---|---|---|
| A1 | A business question linear regression can answer | The null hypothesis is the “no” answer to that question |
| A2 | State the null hypothesis | The line this page is about |
| A3 | Justify why linear regression is appropriate, using the scenario, your question, and your null hypothesis | Regression tests whether the slope in your null is zero |
| B1 | Independent and dependent variables, levels of measurement, sample size | The variables you name here must match your null |
| D1a | Goodness of fit, with a supporting test statistic | The overall F test addresses your null for the whole model |
| D1b | Significance of the independent variable(s) | Where you reject or fail to reject your null |
| D3 | A recommendation aligned with your results | Depends on what you decided in D1b |
What the Null Hypothesis Says in Linear Regression
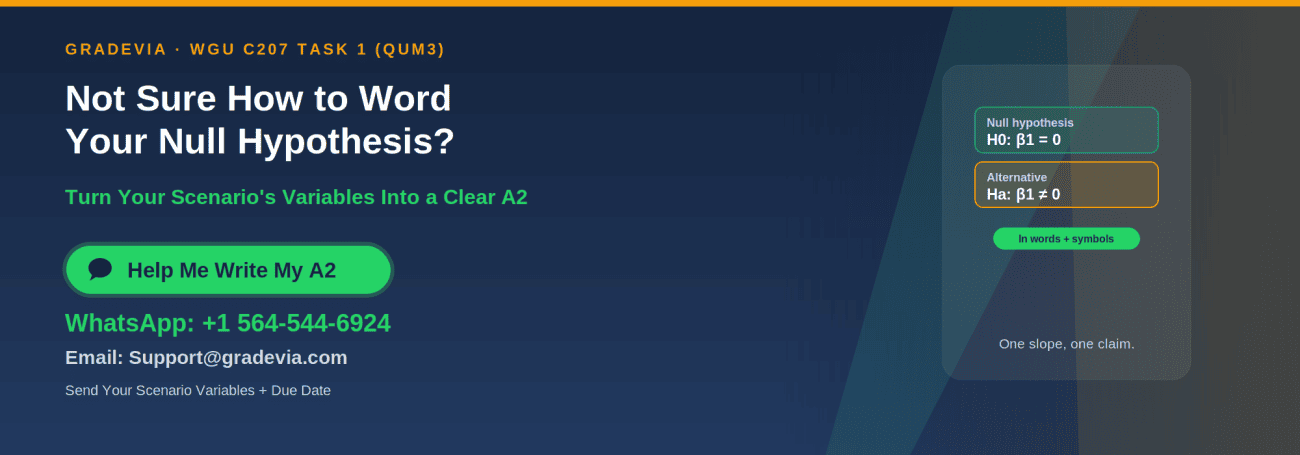
In simple linear regression, the null hypothesis says the independent variable has no linear relationship with the dependent variable. In symbols, the slope of the population regression line is zero:
- H₀: β₁ = 0 (no linear relationship)
- Hₐ: β₁ ≠ 0 (a linear relationship exists)
The t test for the slope and the overall F test in the ANOVA table test this same null hypothesis in simple linear regression and reach the same conclusion (Penn State Eberly College of Science, n.d.-a). It’s also equivalent to testing whether the population correlation is zero, H₀: ρ = 0 (Holmes et al., 2017). So “no linear relationship,” “the slope is zero,” and “no correlation” all describe the same null in a one-predictor model. The slope wording is the most precise for a regression report.
Writing Your Null Hypothesis in Four Steps
- Find your variables. Your scenario tab tells you what the business wants to predict (the dependent variable) and what it thinks drives it (the independent variable).
- State “no linear relationship” in words, naming both variables exactly as your dataset does.
- Add the symbols, H₀: β₁ = 0.
- Add the alternative for clarity, even though A2 asks only for the null.
Template: “H₀: There is no linear relationship between [independent variable] and [dependent variable]; the slope of the regression line is zero (β₁ = 0).”
Vague: “There is no relationship between the variables.”
Specific: “H₀: Monthly advertising spend has no linear relationship with monthly unit sales; the slope of the regression line is zero (β₁ = 0).”
If Your Scenario Has More Than One Independent Variable
The directions refer to “independent variable or variables,” so check your scenario. With two or more predictors, there are two levels of null hypothesis (Penn State Eberly College of Science, n.d.-b):
| Test | Null hypothesis | Where it appears in Excel |
|---|---|---|
| Overall model | H₀: β₁ = β₂ = … = βₖ = 0 (none of the predictors has a linear relationship with the dependent variable) | Significance F in the ANOVA table |
| Each predictor | H₀: βⱼ = 0 for that predictor | The P-value in that predictor’s row of the coefficients table |
For A2, state the overall null in words and symbols. In D1b, discuss each predictor’s own test, because one variable can be significant while another isn’t.
How Would You Write the Null Hypothesis if You Wanted to Test the Differences Statistically?
This question comes up often, and it’s a different situation from QUM3 Task 1. When you compare the means of two groups, such as average sales at stores with and without a promotion, the null hypothesis says there’s no difference between the population means:
- H₀: μ₁ = μ₂
- Hₐ: μ₁ ≠ μ₂
That’s the null for a two-sample test of means (Holmes et al., 2017). It doesn’t belong in C207 Task 1, which tests a relationship between quantitative variables with regression, not a difference between groups. If your null hypothesis mentions “difference” or μ, rewrite it as a statement about the slope.
Wording Mistakes That Cost Points
- Describing a difference instead of a relationship. Use slope or relationship language, not “no difference.”
- Leaving out the variables. “No relationship between the variables” doesn’t tell the evaluator which variables.
- Stating the alternative as the null. The null is always the “no relationship” claim.
- Making it directional. Excel’s regression p-values are two-tailed, so pair your null with a two-sided alternative, β₁ ≠ 0.
- Using causal language. “Training causes visits” goes beyond what observational data can show. Use “linear relationship” or “is a significant predictor of.”
- Saying “prove” or “accept.” You either reject the null or fail to reject it.
Making the Decision in D1b
Compare the p-value with your significance level, usually α = 0.05:
- If p ≤ 0.05: reject H₀. The independent variable is a statistically significant predictor of the dependent variable.
- If p > 0.05: fail to reject H₀. The data don’t provide enough evidence of a linear relationship.
Name the p-value you’re using (the P-value in the independent variable’s row, or Significance F for the overall model), state the decision in terms of H₀, and then say what it means for the business. In a simple linear regression, the slope’s P-value and Significance F are the same, which is a quick check that you’re reading the right numbers.
WGU C207 Tips for the Hypothesis and the Rest of Task 1
- Write A1, A2, and B1 together, so the variables are named the same way in all three.
- In A3, use all three things the prompt lists: a detail from the scenario, your question, and your null hypothesis.
- Paste the full Excel regression output in C1, not a retyped summary.
- Give your scatter plot a chart title, a legend, and both axis titles, as C2 requires.
- In D1a, quote R² and the F statistic; in D1b, quote the p-value and your decision on H₀.
- Base your D3 recommendation on your D1b decision, as the directions’ note on D3 asks.

C207 Task 1 Example: Harbor Lane Coffee
Our C207 Task 1 example is a four page worked example for Harbor Lane Coffee, a fictitious coffee chain, using fictitious data generated for this page. It tests whether staff training hours predict repeat customer visits across 36 stores. It includes:
- A1, A2, and A3, with the null hypothesis in words and symbols
- B1 data characteristics, with levels of measurement
- C1 regression output in the layout of Excel’s Data Analysis ToolPak, and a C2 scatter plot with a title, legend, and axis titles
- The D1a, D1b, and D1c steps that use the null hypothesis, including the decision and the equation
- A caution about causal wording that doubles as a D2 limitation
- Comments explaining what each part does
Here’s its A2:
Null hypothesis (H₀): Staff training hours per month have no linear relationship with repeat customer visits; the slope of the regression line is zero (β₁ = 0).
Your scenario and dataset are generated from your own student ID, so your variables and results will be different. The example shows the method, not your answer.
Download the C207 Task 1 null hypothesis example (.docx)
A Note on the WGU C207 Final Exam
Searches for the WGU C207 final exam usually come from students checking what else the course requires. Check your course page for the assessments in your version of C207. The null hypothesis logic on this page, rejecting or failing to reject based on a p-value, is the same wherever a regression hypothesis test appears.
Pre-Submission Checklist for the Hypothesis
- A2 names both variables exactly as they appear in your dataset
- A2 includes H₀: β₁ = 0 (or the overall null for multiple predictors)
- The null describes a relationship, not a difference
- A3 uses the scenario, your question, and your null hypothesis
- D1b states the p-value, α, and whether you reject or fail to reject H₀
- No “prove,” “accept,” or causal wording
Related C207 Resources
Browse all of our C207 Data-Driven Decision Making guides for running the regression in Excel, reading your output, and the rest of the course.
Frequently Asked Questions
What is the null hypothesis for WGU C207 Task 1?
For simple linear regression, it’s that the independent variable has no linear relationship with the dependent variable, H₀: β₁ = 0. Name both variables from your own scenario.
Do I need to state the alternative hypothesis too?
A2 asks only for the null, but stating the alternative, Hₐ: β₁ ≠ 0, makes your decision in D1b easier to follow.
What if my scenario has two independent variables?
State the overall null, H₀: β₁ = β₂ = 0, in A2. In D1b, discuss each variable’s own p-value, since each tests H₀: βⱼ = 0 for that variable.
Which p-value do I use to decide?
In a simple linear regression, the P-value for the independent variable and Significance F are the same. With more than one predictor, use Significance F for the overall model and each variable’s P-value for that variable.
Is “no correlation” an acceptable null hypothesis?
In simple linear regression it’s statistically equivalent to β₁ = 0, but slope wording fits a regression report more precisely.
Can I use the Harbor Lane Coffee example in my submission?
No. Its company and data are fictitious, and your scenario and dataset are generated from your own student ID. It’s for illustration only.
Want a Second Look Before You Submit?
If you’re working full time and want structured assignment support wording your null hypothesis, reading your Excel output, or connecting your D1b decision to a recommendation, message Gradevia on WhatsApp at +1 564 544 6924 or email Support@gradevia.com.
Sources
Holmes, A., Illowsky, B., & Dean, S. (2017). Introductory business statistics. OpenStax. https://openstax.org/books/introductory-business-statistics/pages/13-2-testing-the-significance-of-the-correlation-coefficient
Penn State Eberly College of Science. (n.d.-a). Lesson 2: SLR model evaluation. STAT 501: Regression methods. https://online.stat.psu.edu/stat501/lesson/2/2.12
Penn State Eberly College of Science. (n.d.-b). 6.4: The hypothesis tests for the slopes. STAT 501: Regression methods. https://online.stat.psu.edu/stat501/lesson/6/6.4