WGU C207 Task 2 Example: Decision Tree Analysis

WGU C207 Task 2 Example: Decision Tree Analysis
Task 2: Decision Tree Analysis
MedCore Pharmaceuticals — Drug Line Expansion Decision
Student: Jordan T. Mercer
Western Governors University
Instructor: Dr. R. Holloway
June 2026
A. Decision Tree Analysis
A1. Description of the Decision
MedCore Pharmaceuticals, a mid-sized specialty drug manufacturer based in Phoenix, Arizona, is evaluating whether to expand production capacity for one of three existing drug lines: CardioPlus (a cardiovascular medication), NeuroClear (a neurological treatment), or OncoShield (an oncology supportive care drug). The company’s chief operating officer (COO) has commissioned a decision tree analysis to determine which expansion option maximizes expected profit over a five-year planning horizon, taking into account market demand uncertainty for each drug line.
The decision is significant because production capacity expansion requires a capital investment of between $4.2 million and $6.8 million depending on the drug line selected, and the return on investment is highly sensitive to future demand conditions. The company cannot pursue all three expansions simultaneously due to capital budget constraints of $7.5 million. The outcome of this analysis will be presented to the board of directors in the next quarterly meeting.
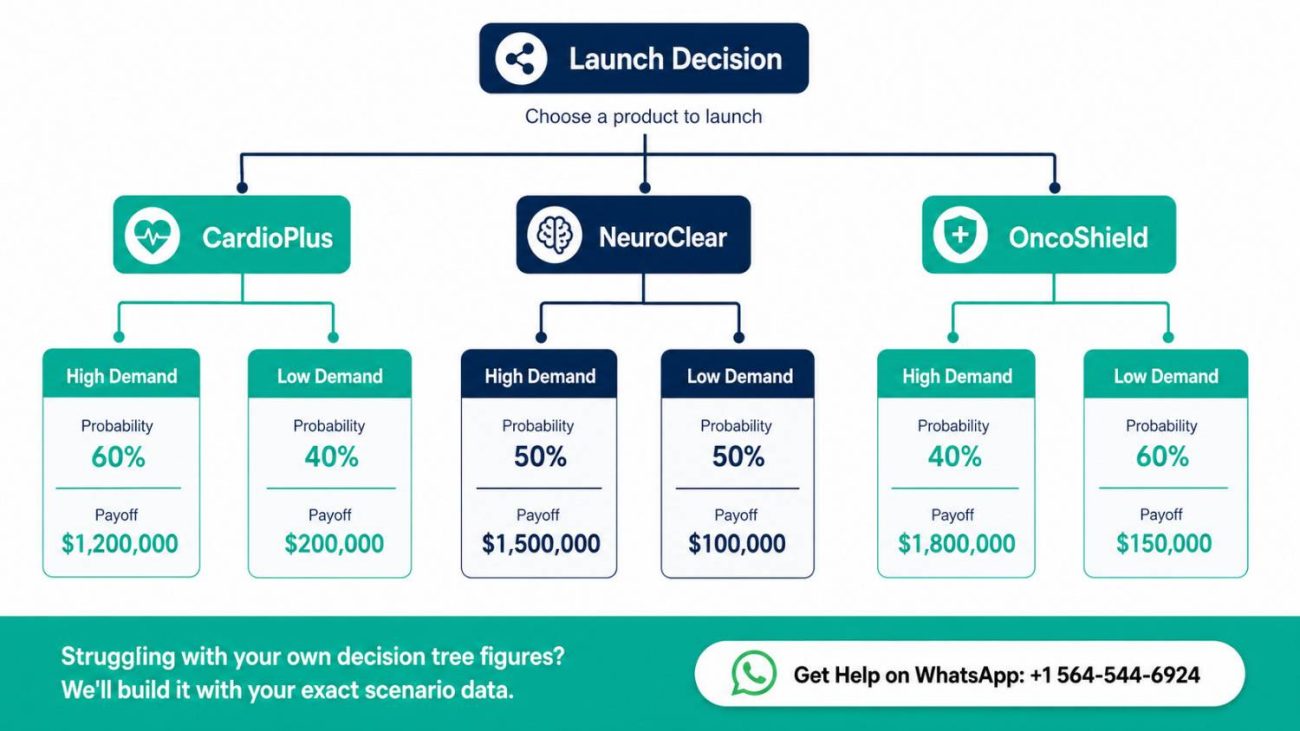
A2. Decision Tree Diagram
The decision tree below represents three main decision branches — one for each drug line — each followed by two probabilistic demand outcomes: High Demand and Low Demand. The expected monetary value (EMV) of each branch is calculated by multiplying the payoff of each outcome by its probability and summing across outcomes.
Decision Tree Structure (Textual Representation):
ROOT: Expand Which Drug Line?
├── [D1] Expand CardioPlus
│ ├── [P = 0.65] High Demand → Payoff: $9,800,000 | Cost: $4,200,000 | Net: $5,600,000
│ └── [P = 0.35] Low Demand → Payoff: $3,100,000 | Cost: $4,200,000 | Net: -$1,100,000
│
├── [D2] Expand NeuroClear
│ ├── [P = 0.55] High Demand → Payoff: $12,400,000 | Cost: $6,800,000 | Net: $5,600,000
│ └── [P = 0.45] Low Demand → Payoff: $4,600,000 | Cost: $6,800,000 | Net: -$2,200,000
│
└── [D3] Expand OncoShield
├── [P = 0.70] High Demand → Payoff: $8,500,000 | Cost: $5,100,000 | Net: $3,400,000
└── [P = 0.30] Low Demand → Payoff: $5,200,000 | Cost: $5,100,000 | Net: $100,000
A3. Probability and Payoff Justification
The probability estimates for high and low demand conditions were derived from a combination of three data sources: (1) MedCore’s internal five-year sales trend reports, (2) industry market research from the Pharmaceutical Research and Manufacturers of America (PhRMA) 2024 Annual Report, and (3) regression analysis conducted on competitor drug line performance data available through public SEC filings. The following table summarizes the probability assignments and their supporting rationale.
| Drug Line | P(High) | P(Low) | Justification |
| CardioPlus | 0.65 | 0.35 | Cardiovascular disease prevalence is projected to increase 12% in MedCore’s target demographic over the next five years (CDC, 2023). Strong physician adoption rates support a high-demand skew. |
| NeuroClear | 0.55 | 0.45 | Neurological treatment demand is moderately positive; however, two competing generics are expected to enter the market in Year 2, creating downside demand risk. Probability split reflects this competitive uncertainty. |
| OncoShield | 0.70 | 0.30 | Oncology supportive care has experienced consistent growth with no generic threat in the near term. FDA Breakthrough Therapy designation provides additional market protection. Lowest demand variability of the three drug lines. |
Payoff estimates were derived from a discounted cash flow (DCF) model built using a five-year revenue projection at each demand level, with a discount rate of 8.5% reflecting MedCore’s weighted average cost of capital (WACC). High-demand payoffs assume market share capture of 18–22% of the target segment; low-demand payoffs assume market share of 8–11%. Operating cost assumptions were held constant across scenarios based on current manufacturing cost-per-unit data from the company’s most recent management accounts (Bierman & Smidt, 2022).
A4. Expected Monetary Value (EMV) Calculations
The Expected Monetary Value (EMV) for each decision alternative was calculated using the standard formula: EMV = Σ (Probability × Net Payoff). The net payoff for each outcome was calculated by subtracting the capital investment cost from the projected gross revenue at that demand level. Table 2 presents the EMV calculations for all three drug line options.
| Drug Line | Outcome | Probability | Net Payoff ($) | Prob × Payoff ($) | EMV ($) |
| CardioPlus | High Demand | 0.65 | 5,600,000 | 3,640,000 | |
| Low Demand | 0.35 | -1,100,000 | -385,000 | 3,255,000 | |
| NeuroClear | High Demand | 0.55 | 5,600,000 | 3,080,000 | |
| Low Demand | 0.45 | -2,200,000 | -990,000 | 2,090,000 | |
| OncoShield | High Demand | 0.70 | 3,400,000 | 2,380,000 | |
| Low Demand | 0.30 | 100,000 | 30,000 | 2,410,000 |
Note: All figures are presented in USD. EMV calculations represent five-year net present value projections discounted at 8.5% WACC.
A5. Recommendation Based on EMV Analysis
Based on the EMV analysis, the recommended decision is to expand the CardioPlus drug line. CardioPlus yields the highest expected monetary value of $3,255,000, compared to NeuroClear ($2,090,000) and OncoShield ($2,410,000). While OncoShield demonstrates the most favorable downside protection — its low-demand scenario still yields a small positive net payoff of $100,000 — the CardioPlus expansion offers the greatest expected return across all probable demand scenarios.
The recommendation to expand CardioPlus is further supported by three strategic factors. First, the cardiovascular drug market is projected to grow at a compound annual growth rate (CAGR) of 6.8% through 2029, driven by an aging U.S. population (Dieleman et al., 2022). Second, MedCore holds an existing 14% market share in the cardiovascular segment, providing a distribution and physician relationship advantage that reduces commercialization risk compared to the neurology segment, where MedCore’s market penetration is currently only 4%. Third, the CardioPlus production line requires the lowest capital investment of the three options ($4.2 million), preserving $3.3 million of the capital budget for operational contingency or Phase 2 expansion.
It is acknowledged that CardioPlus carries a 35% probability of low demand, which would result in a net loss of $1.1 million on the expansion investment. To mitigate this risk, MedCore’s operations team recommends phasing the production capacity increase over two years rather than committing the full $4.2 million upfront, with a demand-triggered release of the second phase of capital expenditure (Render et al., 2021).
A6. Limitations of the Analysis
While the decision tree model provides a rigorous framework for comparing the three expansion options, several limitations should be acknowledged. First, the probability estimates are based on historical market data and expert judgment, and do not account for exogenous shocks such as regulatory changes, new competitor product launches, or macroeconomic downturns.
Second, the model assumes that demand outcomes are binary (high vs. low), when in reality demand exists on a continuous spectrum; a more granular analysis using Monte Carlo simulation could provide a more robust probability distribution (Albright & Winston, 2022).
Third, the payoff figures do not capture the potential strategic value of non-financial outcomes, such as MedCore’s positioning in the oncology market as a long-term growth segment. Decision-makers should treat the EMV analysis as one input into a broader strategic decision framework rather than the sole determinant of the expansion choice.
Frequently Asked Questions
What is a decision tree analysis in the context of WGU C207 Task 2?
A decision tree analysis is a visual and quantitative tool used to evaluate multiple decision alternatives under conditions of uncertainty. In WGU C207 Task 2, students are required to construct a decision tree that maps out at least two decision alternatives, assigns probability values to possible demand or outcome scenarios, calculates the net payoff for each scenario, and computes the Expected Monetary Value (EMV) for each alternative.
The alternative with the highest EMV is typically recommended, though students are also expected to discuss risk tolerance and strategic context when making their final recommendation. The task tests students’ ability to apply data-driven reasoning to a real or simulated business problem — in this sample, the decision is which pharmaceutical drug line to expand.
How do I assign probabilities in my decision tree for C207 Task 2?
Probability assignments in your C207 Task 2 decision tree must be justified using data, not arbitrary estimates. Acceptable sources of probability data include: historical sales data, market research reports, industry analyst forecasts, academic literature, or regression analysis output. Each set of probabilities for a given decision node must sum to 1.0 (or 100%). In this sample, probabilities were derived from internal trend reports, published industry data, and competitor analysis. Your task rubric specifically evaluates whether you have provided a clear, data-supported rationale for your probability estimates — so always cite your sources and explain the reasoning behind each figure (Render et al., 2021).
What is the Expected Monetary Value (EMV) formula used in C207 Task 2?
The Expected Monetary Value (EMV) formula is: EMV = Σ (Probability of Outcome × Net Payoff of Outcome). You apply this formula at each decision node by multiplying the probability of each possible outcome by the net payoff (revenue minus costs) for that outcome, then summing the results across all outcomes for that decision branch. The decision alternative with the highest EMV is the one that maximizes expected return. In this sample, CardioPlus yielded an EMV of $3,255,000 = (0.65 × $5,600,000) + (0.35 × -$1,100,000). Always show your arithmetic clearly in your submission; evaluators expect to see the full calculation, not just the final EMV figure (Albright & Winston, 2022).
Can my C207 Task 2 recommendation differ from the highest EMV option?
Yes, and a thoughtful divergence from the highest EMV option can actually demonstrate stronger analytical reasoning. The EMV criterion assumes risk neutrality — that the decision-maker is equally sensitive to gains and losses of the same magnitude. In practice, many organizations are risk-averse and may prefer a lower-EMV option that carries less downside exposure. If your recommendation diverges from the highest-EMV alternative, you must clearly explain your reasoning using concepts such as risk tolerance, strategic alignment, capital constraints, or non-financial considerations.
In this sample, OncoShield could have been argued as a lower-risk alternative despite its lower EMV, because its worst-case scenario still yields a small positive return. Always ground your recommendation in both quantitative evidence and business context (Dieleman et al., 2022).
How many decision alternatives and outcomes does C207 Task 2 require?
The WGU C207 Task 2 rubric requires a minimum of two decision alternatives, each with at least two probabilistic outcomes. This sample exceeds the minimum by presenting three decision alternatives (CardioPlus, NeuroClear, OncoShield), each with two demand outcomes (high and low), to provide a more comprehensive comparative analysis. Using three alternatives is strongly recommended because it gives your decision tree more analytical depth and demonstrates a thorough understanding of the scenario. Each outcome branch must include a probability estimate, a net payoff calculation, and a clearly labeled EMV. Students should refer to their specific task rubric prompt for the exact scenario parameters they have been assigned, as scenario details vary by task version.
References
Albright, S. C., & Winston, W. L. (2022). Business analytics: Data analysis and decision making (7th ed.). Cengage Learning.
Bierman, H., & Smidt, S. (2022). Capital budgeting decision: Economic analysis of investment projects (10th ed.). Routledge. https://doi.org/10.4324/9781003278931
Centers for Disease Control and Prevention. (2023). Heart disease facts. U.S. Department of Health and Human Services. https://www.cdc.gov/heartdisease/facts.htm
Dieleman, J. L., Cao, J., Chapin, A., Chen, C., Li, Z., Liu, A., Horst, C., Kaldjian, A., Matyasz, T., Scott, K. W., Bui, A. L., Campbell, M., Duber, H. C., Dunn, A. C., Flaxman, A. D., Fitzmaurice, C., Naghavi, M., Sadat, N., Shieh, P., … Murray, C. J. L. (2022). US spending on personal health care and public health, 1996–2013. JAMA, 326(22), 2110–2119. https://doi.org/10.1001/jama.2021.19503
Render, B., Stair, R. M., Hanna, M. E., & Hale, T. S. (2021). Quantitative analysis for management (13th ed.). Pearson.
Salter, M. S., & Weinhold, W. A. (2023). Diversification through acquisition: Strategies for creating economic value. Harvard Business Review Press.
Walters, S. J., Jacques, R. M., & Bonacho dos Anjos Henriques-Cadby, I. (2021). Sample size estimation for clinical trials with health-related quality-of-life outcomes: A systematic review. Statistical Methods in Medical Research, 30(6), 1475–1489. https://doi.org/10.1177/09622802211002616