
Blog
WGU D472 Task 1 Guide and Example: The Supply Chain Disruption PowerPoint

By Dan Palmer, MBA · Academic strategy consultant for working adult learners · LinkedIn
Updated on: Oct 14, 2026
D472 Task 1 puts you in the role of a consultant. Autojor Manufacturing (AJM), the automotive electronics maker in the case study, has just come through an operations and supply chain disruption, and you present your evaluation to its senior leadership team: what happened, which risks caused it, how it hit daily operations, how the company held up and recovered, and which of three proposed solutions it should adopt for the long term. The deliverable is a D472 PowerPoint, suggested at 10 to 15 slides, with presenter notes on every content slide.
For a working learner, the hard part isn’t building slides. It’s that almost every rubric aspect asks for relevant details from the case study, two aspects require the data in the supporting spreadsheet, and the solution section asks for both qualitative and quantitative analysis. This guide shows how to work through the case study and data efficiently, what each slide needs to prove, and how to review your D472 Task 1 against the rubric before you submit. It ends with a D472 Task 1 example deck built on a fictitious company.
D472 Task 1 Assignment
Introduction
Even in its simplest form, supply chain management is a complex process with many moving parts. However, over the past several years, supply chain management has been undergoing an evolution fueled by complex and intertwined domestic and global factors, such as political upheaval, economic stresses, legislative changes, changing technology, natural disasters, and health crises. These factors pose risks to a business’s supply chain resilience, increasing the potential for significant disruptions to its business operations.
Scenario
You are a consultant for a company that recently experienced an operation and supply chain disruption. You are tasked with analyzing relevant qualitative and quantitative data related to the company’s operation and supply chain disruption and evaluating possible solutions to the problem. You will also recommend a solution for long-term risk mitigation and supply chain viability to the senior leadership team.
See the attached “D472 Task 1 Case Study” and “D472 Task 1 Supporting Data” in the Supporting Documents section for additional information and data.
What D472 Task 1 Asks You to Do
The D472 Task 1 WGU directions list it as FKN1 Task 1: Operations and Supply Chain Disruption, part of 21st Century Operations and Supply Chain, D472. You work from two supporting documents: the D472 Task 1 Case Study (a PDF) and the D472 Task 1 Supporting Data (an Excel file).
| Requirement | What the slide or notes must show |
|---|---|
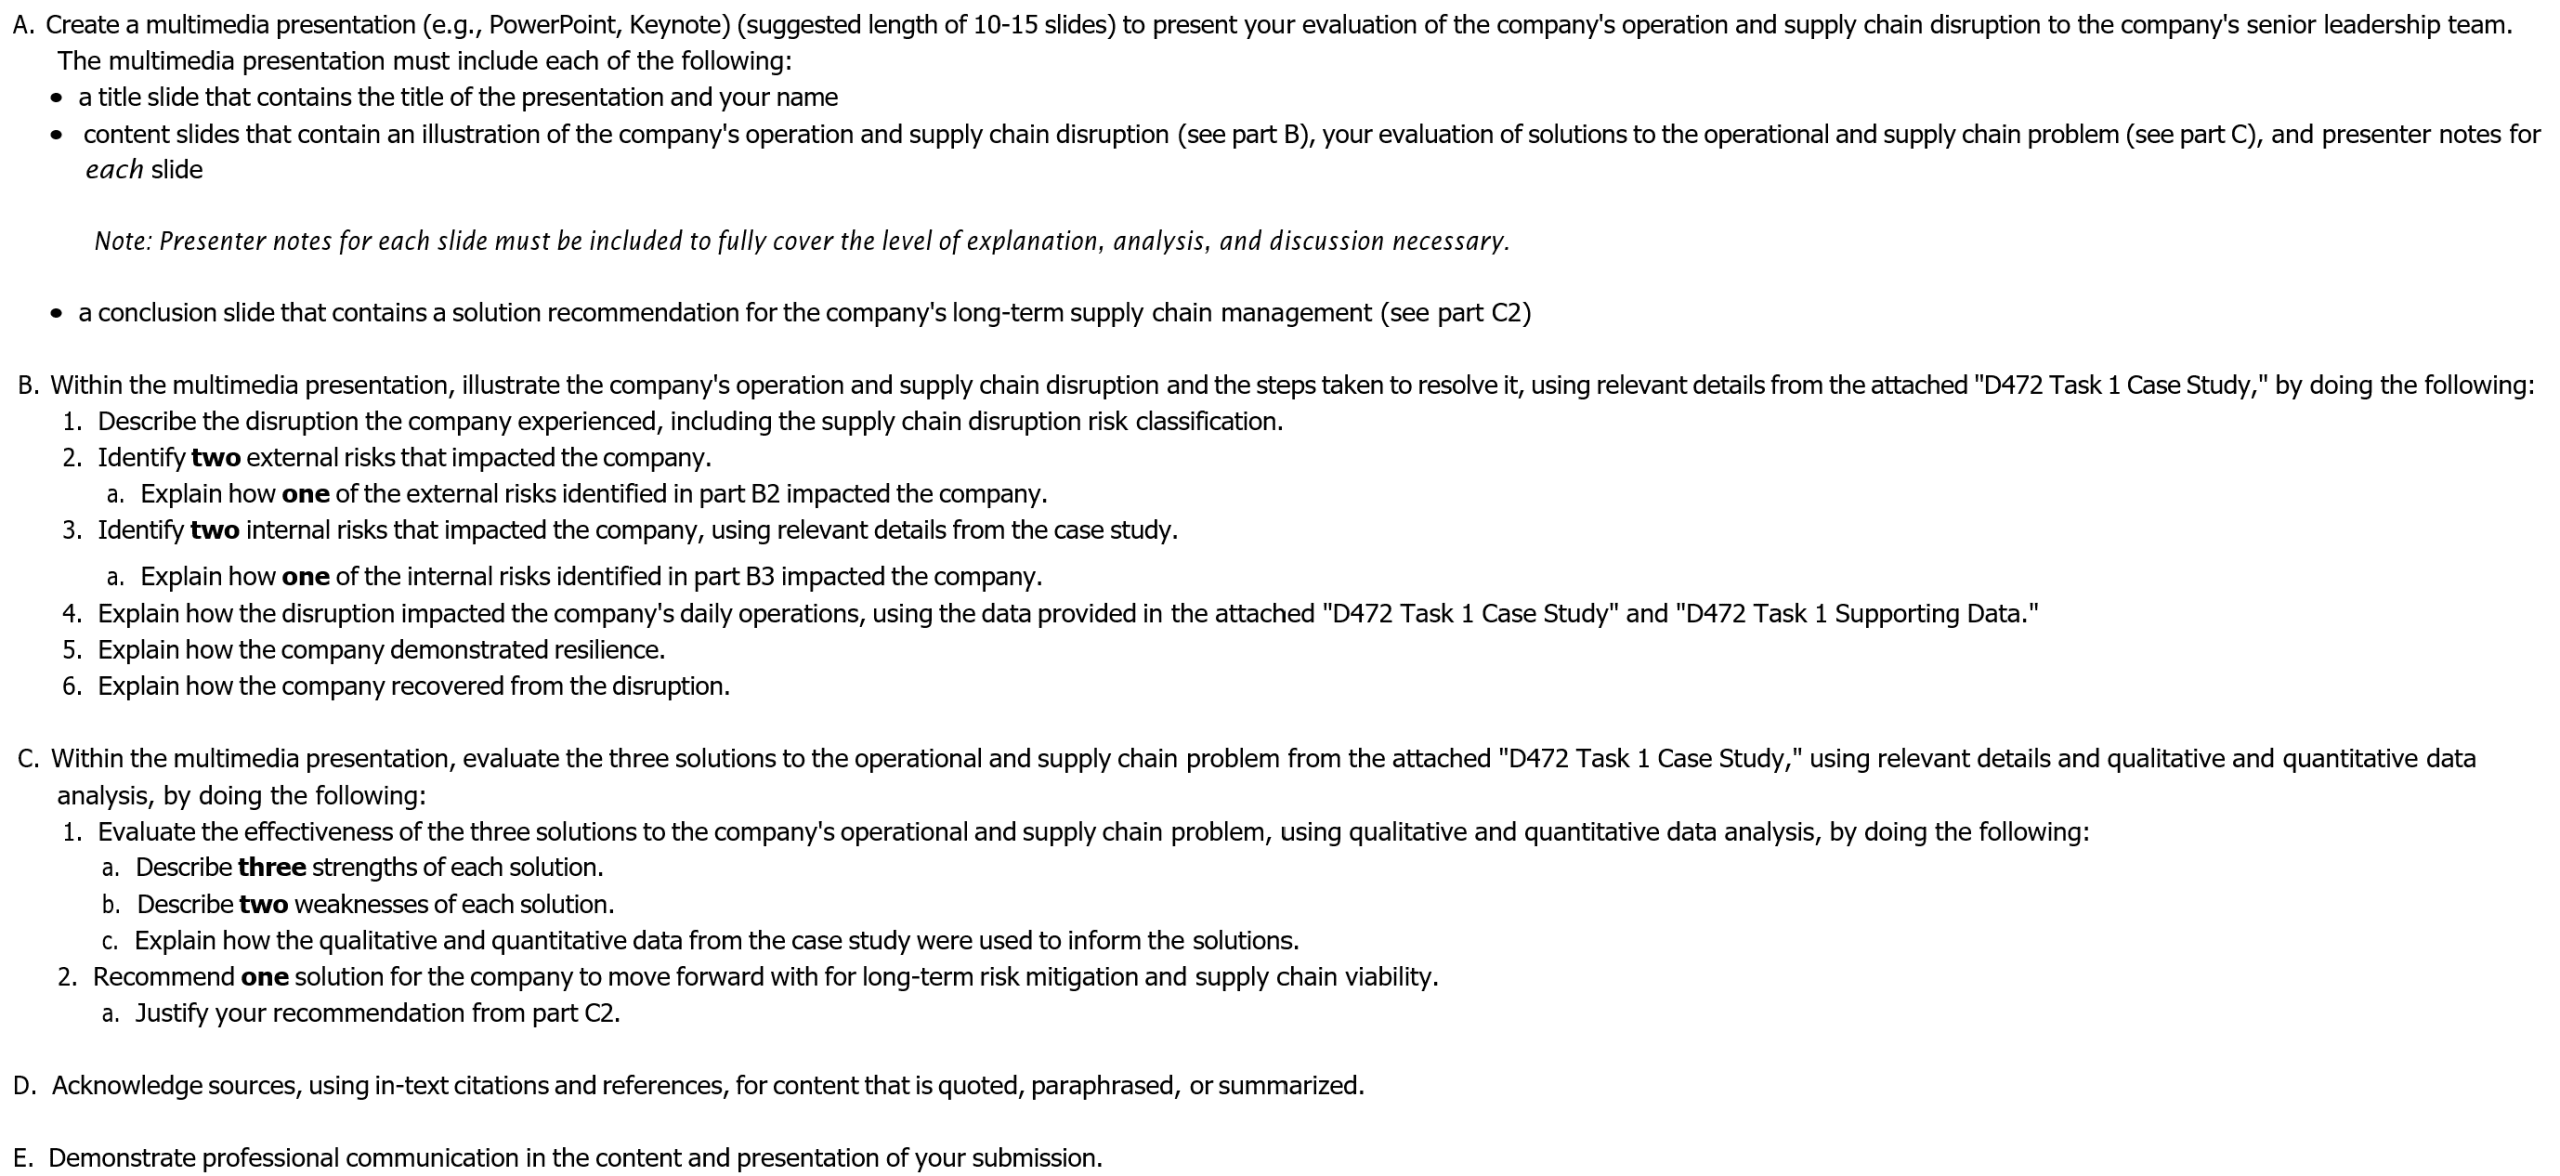
| A | A title slide with the presentation title and your name; content slides for Parts B and C with presenter notes on every content slide; a conclusion slide with your recommendation |
| B1 | The disruption, with an accurate supply chain disruption risk classification |
| B2, B2a | Two external risks, then how one of them affected the company |
| B3, B3a | Two internal risks, then how one of them affected the company |
| B4 | How the disruption affected daily operations, using the case study and the supporting data |
| B5 | How the company demonstrated resilience |
| B6 | How the company recovered |
| C1a, C1b | Three strengths and two weaknesses of each of the three solutions in the case study |
| C1c | How the qualitative and quantitative data informed the solutions |
| C2, C2a | One recommended solution for long-term risk mitigation and supply chain viability, and its justification |
| D | In-text citations and a reference list |
| E | Professional communication, checked through Grammarly for Education |
The rubric also scores organization: the deck must be logical, easy to follow, and make appropriate use of text, graphics, and multimedia for a senior leadership audience. Submit the .pptx file itself. The directions don’t accept cloud links such as Google Slides or OneDrive.
What’s in the Autojor Case Study
The case study is seven pages, and it’s organized in the order the task asks for. Knowing where each part sits saves rereading:
| Case study section | What it gives you | Use it for |
|---|---|---|
| Background | AJM in Louisville, Kentucky, and its single supplier in Houston, Texas, which provides 100% of a key component | B1, B3 |
| Disruption | The supplier’s fire, the shutdown, expedited freight, the response team, employee and media concerns, and the effect on the three automotive customers | B1, B2, B3 |
| Resilience | The short term actions AJM took while the disruption was underway | B5 |
| Data Analysis | The production impact, the customer and OEM effects, executive concerns about the response, and the ERP, barcode, and EDI findings | B3, B4, B6, C1c |
| Solutions 1 to 3 | A multisource supply chain, 3D printing, and third-party inventory warehouse integration | C1, C2 |
| Graphs and 3D Printing Option Data | Descriptions of the two inventory graphs, plus the cost and payback table for the 3D printing option | B4, C1 |
Read it once and sort what you find into five lists: the event, causes outside AJM’s control, weaknesses inside AJM, actions during and after the disruption, and every figure attached to each solution. Every rubric aspect asks for relevant case study details, so keeping these lists saves you from going back to the PDF for each slide.
What’s in the Supporting Data Spreadsheet
The D472 Task 1 Supporting Data workbook has two working tabs, both weekly from January 2 to May 8, 2023:
| Tab | What it shows | Rows to notice at the bottom |
|---|---|---|
| Finished Goods Inventory | On hand, open orders, and the weekly change (Inv + -) for Elecktore, Lexiplus, Cadallia, and OEM | Weekly production, maximum production, and the min-max range for each product line (OEM has none) |
| Components Demand-Inventory | Weekly demand and on hand for components LC345, LC878, LC543, and LC879 | The min-max row at the top, weekly replenishment, maximum capacity, and how many of each component one finished unit uses |
A few things in the data are worth understanding before you write B4:
- The two tabs are linked. Component demand is calculated from finished goods orders using the “units per FG unit” row, so a shortage in one component shows up in the product lines that use it.
- Compare on hand with min-max. The min-max ranges tell you where inventory is supposed to sit. Plotting each line’s on hand against its minimum shows when, and by how much, AJM fell below its own safety level.
- Look for values that stop or turn negative. Some series drop to zero, go below zero, or stop being reported. Work out what each pattern means operationally before you describe it.
- Read the weekly change column. Inv + – shows the direction and size of each week’s movement, which helps you date the decline and the rebound.
A single chart from one tab, built in your own deck, is usually the clearest way to illustrate the impact on daily operations.
A D472 Task 1 PowerPoint Slide Plan
The 10 to 15 slide suggestion fits one slide per requirement, plus a title, a conclusion, and references:
| Slide | Covers |
|---|---|
| 1. Title | Presentation title and your name |
| 2. The disruption | B1, including the risk classification |
| 3. External risks | B2 and B2a |
| 4. Internal risks | B3 and B3a |
| 5. Impact on daily operations | B4, with a chart from the supporting data |
| 6. Resilience | B5 |
| 7. Recovery | B6 |
| 8 to 10. One slide per solution | C1a and C1b |
| 11. How the data informed the solutions | C1c |
| 12. Conclusion | C2 and C2a |
| 13. References | D |
That’s 13 slides, inside the suggested range, and every rubric aspect has a slide the evaluator can find without searching.
Part B: Illustrating the Disruption
B1: Describe the disruption and classify the risk
Describe what happened in two or three sentences, then classify it. Supply chain research groups disruption risks by their source (supply side, demand side, operational, or environmental) and by their likelihood and impact (Katsaliaki et al., 2022). Use the classification terms from your course materials, and explain why the event fits: a rare event with a severe effect is a different classification from a frequent, minor one. An accurate classification is what separates a Competent B1 from an Approaching Competence one.
B2 and B3: External and internal risks
The test for each risk is simple. External risks come from outside the company, such as weather, geopolitics, regulation, a supplier’s own failure, or market conditions. Internal risks come from the company’s own choices, such as sourcing strategy, inventory policy, systems, staffing, or planning. A risk that the company created, such as relying on one supplier, is internal even though the supplier is outside the company.
You identify two of each, but you only explain one of each in depth (B2a and B3a). Pick the one with the clearest chain of cause and effect in the case study.
B4: Impact on daily operations
B4 is the aspect that names both supporting documents, so use the case study and the spreadsheet together. The case study states the headline impact on production; the spreadsheet lets you show it week by week. Name the measures that changed, give before and during figures with dates, and say what that meant day to day for AJM: which product lines kept shipping, which stopped, how far inventory fell against its minimum, and how long it took to turn around. “Inventory dropped” isn’t enough. “Product line X fell from A units on date B to C units on date D, against a minimum of E” is.
B5 and B6: Resilience versus recovery
These two are easy to blur together. Resilience is what the company did to keep operating while the disruption was happening. The case study has a section titled Resilience that describes these short term actions. Recovery is how AJM got back to a secure position afterward. For B6, combine what the case study says about the recovery with the rebound you can see in the spreadsheet, and be honest about what the case says still needs work, such as the time it took to reach a secure inventory level. Give each its own slide and its own evidence.
Part C: Evaluating the Three Solutions
The case study gives you three solutions: a multisource supply chain, 3D printing, and third-party inventory warehouse integration. You don’t choose them; you evaluate them. The case lists benefits for Solutions 1 and 3 and gives a full cost table for Solution 2, so the evidence for each looks different.
C1a and C1b: Strengths and weaknesses
Each solution needs three strengths and two weaknesses, which is 15 points in total. Make each point specific to the case:
Weak: “This solution reduces risk.”
Specific: “A second supplier would cover up to 40% of volume, so a closure at one site would no longer stop every line.”
Don’t just copy the benefits the case lists. A strength is stronger when you connect it to what went wrong at AJM, and a weakness is stronger when it’s something the case leaves unsolved or unpriced. Ask of each solution: does it fix the single source problem, the slow response, or the capital tied up in min-max inventory, and what would it cost or risk?
Rebuild the 3D printing table yourself. It’s the only solution with full figures, and recalculating it is the quickest way to find evidence for both strengths and weaknesses. Check that each line multiplies out, that the total includes every cost, including the recurring ones, and that the payback period uses the right savings figure. Whatever you find, show your calculation on the slide or in the notes.
C1c: How the data informed the solutions
This aspect asks how the qualitative and quantitative data from the case study were used to inform the solutions. Show both kinds:
- Quantitative: figures from the spreadsheet and the 3D printing table, such as inventory against min-max, the production impact, costs, demand, and payback
- Qualitative: the case study’s descriptions, such as the executives’ concerns about the response team and the single supplier, the leadership’s view of capital tied up in inventory, employee and customer communication, and the ERP, barcode, and EDI findings
A three column table with the solution, the quantitative data behind it, and the qualitative data behind it covers this cleanly on one slide.
C2 and C2a: One recommendation, justified
Recommend one solution for long-term risk mitigation and supply chain viability. Those words matter. A strong justification explains why your choice addresses the root cause of the disruption, how it holds up against future disruptions, and why its costs are worth it compared with the other two. Supply chain viability is a system’s ability to survive and adapt through disruptions over time (Ivanov, 2021), so a short term fix is harder to justify than a structural one. Any of the three solutions can be recommended if the justification is logical and grounded in the case.
Presenter Notes on Every Content Slide
The directions are explicit: presenter notes must be included for each slide “to fully cover the level of explanation, analysis, and discussion necessary.” Treat the slide as the headline and the notes as your explanation. A useful pattern for each content slide’s notes:
- What the slide shows, in one sentence
- The case study details or data behind it
- Why it matters to senior leadership
Write the notes in full sentences, as you’d say them in the room. Notes that repeat the slide’s bullet points don’t add the analysis the rubric is looking for.
Section D: Citing Sources
Cite the D472 Task 1 Case Study and Supporting Data as your course directs, and cite any outside research on slides and in notes, with a references slide at the end. The rubric checks that the reference list identifies author, date, title, and source location. Make sure every source you cite is real and opens to the page you used.
D472 Task 1 Review: Check Your Deck Against the Rubric
Before you submit, run this D472 Task 1 review, one rubric aspect at a time:
| Aspect | Ask yourself |
|---|---|
| A: Presentation | Is my name on the title slide? Does every content slide have notes? Is there a conclusion slide? |
| A: Organization | Can someone follow the deck in order without me explaining it? |
| B1 | Did I name a classification and explain why it fits? |
| B2, B3 | Are two risks clearly external and two clearly internal? |
| B2a, B3a | Did I explain the impact of one of each, with case study details? |
| B4 | Did I use dated figures from the supporting data, compared with min-max, not only the case narrative? |
| B5, B6 | Are resilience and recovery on separate slides with different evidence? |
| C1a, C1b | Does every solution have exactly three strengths and two weaknesses? |
| C1c | Did I show both qualitative and quantitative data? |
| C2, C2a | Did I recommend one solution and justify it for the long term? |
| D, E | Are sources cited in text and listed? Is Grammarly clear? |
D472 Task 1 Example: Harlow Kitchenware
Our D472 Task 1 example is a 13 slide deck for Harlow Kitchenware, a fictitious stand mixer manufacturer, not the company in the WGU case study. A typhoon closes the port serving its only motor supplier for 19 days, and the deck works through every requirement:
- A risk classification with a cited source
- Two external and two internal risks, with one of each explained
- A native PowerPoint chart of weekly output against plan for B4
- Separate resilience and recovery slides
- Three fictitious solutions, each with three strengths and two weaknesses
- A data table for C1c and a justified recommendation on the conclusion slide
- Presenter notes on every slide
Here’s part of the presenter notes for its recommendation slide:
It’s the only option that removes the root cause, our single source. Safety stock only works for disruptions shorter than 30 days, and monitoring gives warning without adding supply.
Every slide carries a fictitious example notice. Your submission must evaluate the company and the three solutions in your own case study, using its data and your own words.
Download the D472 Task 1 example deck (.pptx)
Why Copying a D472 Task 1 Answer Backfires
Every student in the current version works from the same case study, the same spreadsheet, and the same three solutions. Decks posted online as D472 Task 1 answers therefore overlap heavily, and that overlap is exactly what the WGU similarity checker is built to find. The directions ask you to review the similarity report before submitting for that reason. Your own notes from the case study are the fastest route to a deck that’s clearly yours.
Plan It Around Your Work Week
- Evening one (about 2 hours): Read the case study, sort it into the five lists, and pull the B4 figures from the supporting data.
- Evening two (about 2.5 hours): Build slides 1 to 7 (Part B) with notes, including the B4 chart.
- Evening three (about 2.5 hours): Build the three solution slides, the C1c table, and the conclusion, with notes.
- Evening four (about 1 hour): Add references, run the rubric review, check Grammarly and the similarity report, and submit the .pptx.
Common Reasons D472 Task 1 Comes Back
- No name on the title slide, or no separate conclusion slide
- Presenter notes missing from one or more content slides
- A risk classification that’s missing or doesn’t fit the event
- An internal risk listed as external, or the reverse
- B4 written from the case narrative without figures from the supporting data
- Resilience and recovery merged into one slide with the same evidence
- A solution with fewer than three strengths or two weaknesses
- C1c covering only quantitative data, or only qualitative
- A recommendation that combines solutions instead of choosing one
Related WGU Guides
- See every D472 guide in one place.
- D473 continues the supply chain work. Our WGU D473 Task 1 guide covers finding service and cost variables in a data file and presenting solutions with KPIs.
- For root causes and control plans, see our D469 DMAIC model guide.
- Presenting financial evidence to leadership is covered in our WGU C216 Task 1 guide.
- Browse all WGU assignment guides and samples.
Frequently Asked Questions
What is D472 Task 1 at WGU?
It’s the FKN1 Task 1 performance assessment in D472, 21st Century Operations and Supply Chain. You act as a consultant and present an evaluation of Autojor Manufacturing’s supply chain disruption, its risks, its response, and three possible solutions to senior leadership.
What’s in the D472 Task 1 Supporting Data?
Two weekly tabs from January 2 to May 8, 2023: finished goods inventory for Elecktore, Lexiplus, Cadallia, and OEM, and demand and on hand for four components. Both include min-max levels, which you can compare with on hand inventory for B4.
How many slides should the D472 Task 1 PowerPoint have?
The directions suggest 10 to 15 slides, including a title slide with your name and a conclusion slide with your recommendation.
Do I need presenter notes on every slide?
Yes. The directions require presenter notes for each content slide, and the rubric checks for them.
Can I recommend more than one solution?
No. C2 asks you to recommend one solution for long-term risk mitigation and supply chain viability, and C2a asks you to justify it.
Which solution should I recommend in D472 Task 1?
Any of the three can work. What the rubric scores is whether your recommendation is logical and justified with relevant details from the case study.
Can I submit the Harlow Kitchenware example?
No. It uses a fictitious company with invented data and is for illustration only. Your deck must evaluate the company in your own case study, in your own words.
Want a Second Look Before You Submit?
If you’re working full time and want structured assignment support pulling the right figures from the supporting data, writing presenter notes with real analysis, or reviewing your deck against each rubric aspect before you submit, message Gradevia on WhatsApp at +1 564 544 6924.
Sources
Ivanov, D. (2021). Supply chain viability and the COVID-19 pandemic: A conceptual and formal generalisation of four major adaptation strategies. International Journal of Production Research, 59(12), 3535–3552. https://doi.org/10.1080/00207543.2021.1890852
Katsaliaki, K., Galetsi, P., & Kumar, S. (2022). Supply chain disruptions and resilience: A major review and future research agenda. Annals of Operations Research, 319(1), 965–1002. https://doi.org/10.1007/s10479-020-03912-1