
Blog
Perfect-Score Writing Guide: WGU D473 Task 1 Guide + Example

Assignment: WGU D473 Task 1
FAN1 Solutions Design & Visualization Capstone
Endothon Supply Chain Network Redesign
Endothon is a prominent manufacturer of silicone caulk products and supplies various options to “big-box” retailers (i.e., large establishments that offer a wide array of products). These silicone caulk products are in high demand due to their widespread usage by end-users involved in construction projects. However, the existing supply chain network has remained unchanged for the past 30 years, leading to inefficiencies and increased operational costs.
Endothon needs to improve its overall operational efficiency, reduce lead times, and eliminate unnecessary costs. To address these challenges, senior leadership has decided to initiate a full review of the current processes. Leadership and has chosen you, the operations manager, to lead the project—from the analysis of the data collection to the implementation of key performance indicators.
Your leadership team has collaborated with cross-functional teams, continual improvement experts, and outside consultants to identify potential opportunities and challenges in the execution of this project. A comprehensive data file, titled “Endothon Data File,” has been developed for you as a foundation from which you will begin your analysis.
You will gain background information about the case using the “Endothon Case Study” supporting document. You will analyze the collected data in the “Endothon Data File” supporting document and provide your responses to part A of this task using the “Endothon Data Analysis File” supporting document. You will then create a presentation in part B of this task to synthesize and justify your findings.
A. Use the data in the “Endothon Data File” and relevant details in the “Endothon Case Study” to complete the following:
-
Identify one key variable that directly contributes to the current supply chain network service problem.
a. Justify your response using quantitative data from the “Endothon Data File.”
Note: Place your responses in tab A1 of the “Endothon Data Analysis File.”
- Identify two key variables that directly contribute to the current supply chain network cost problem.
b. Justify your response using quantitative data from the “Endothon Data File.”
Note: Place your responses in tab A2 of the “Endothon Data Analysis File.”
- Create a cause-effect table to describe the root causes of each of the three variables identified in parts A1 and A2.
Note: Place your responses in tab A3 of the “Endothon Data Analysis File.”
B. Create a multimedia presentation for the senior leadership team in which you provide and support data-informed recommendations. Include presenter notes for each slide using relevant details from both the “Endothon Case Study” and the “Endothon Data File.” Within your presentation, you must complete the following:
-
Develop a project charter by doing the following:
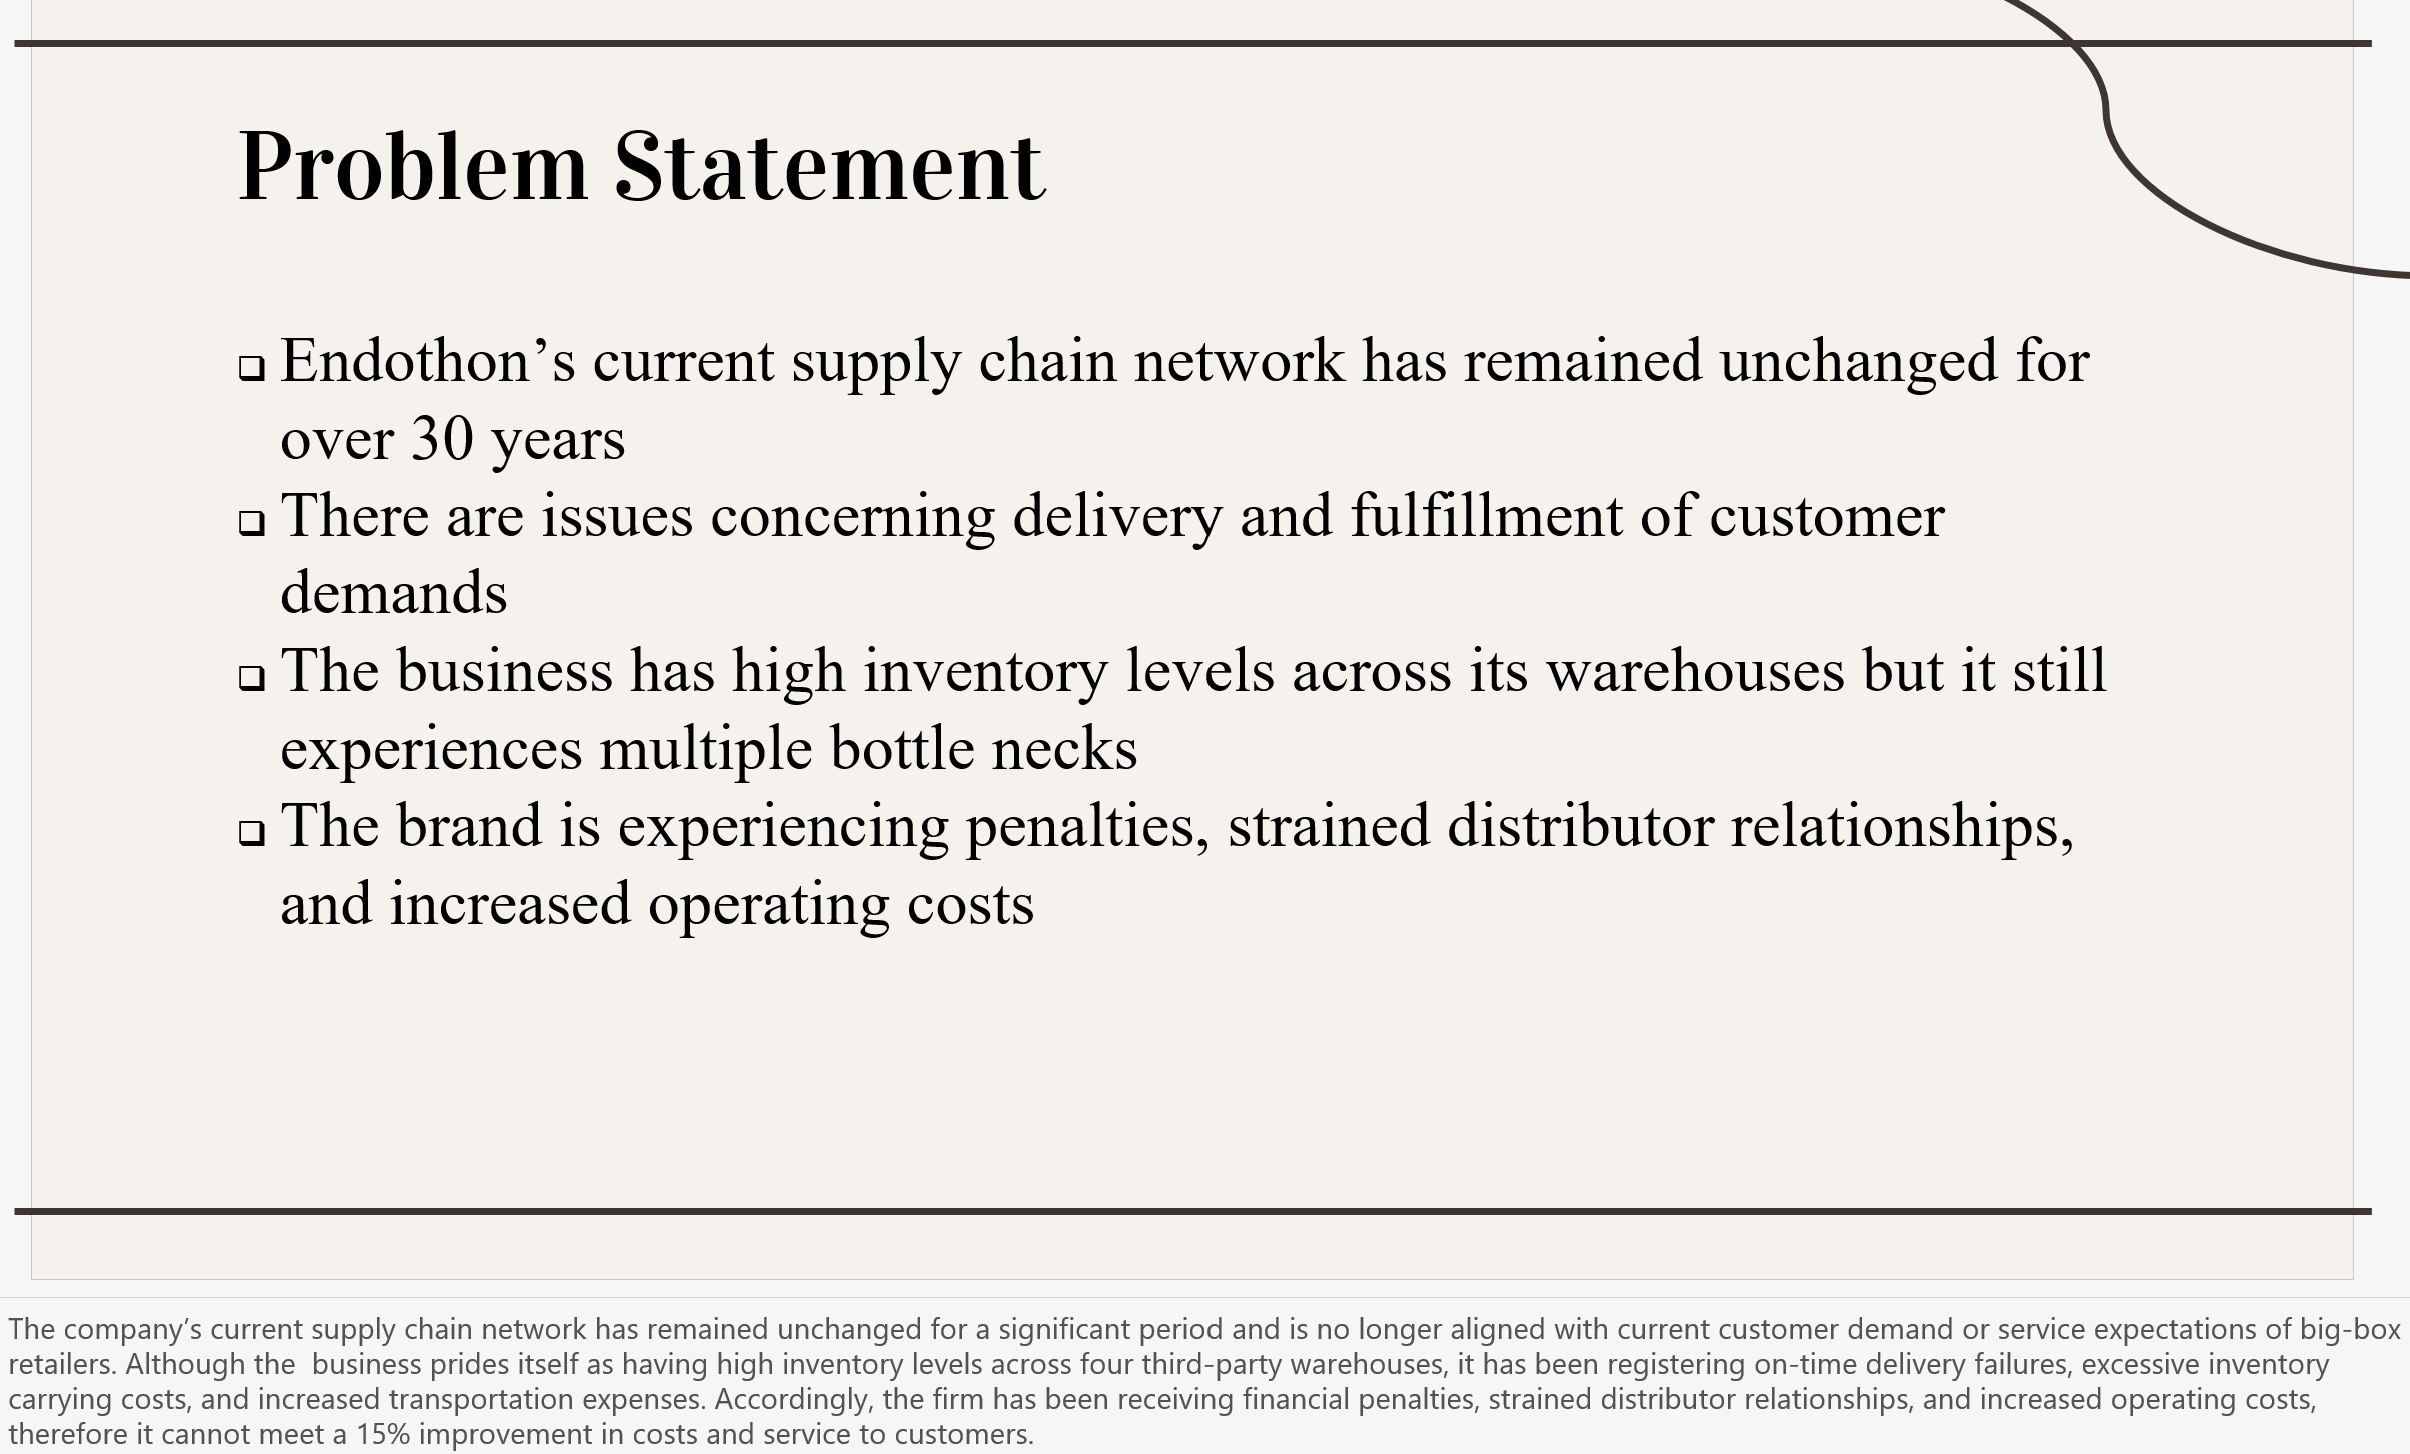
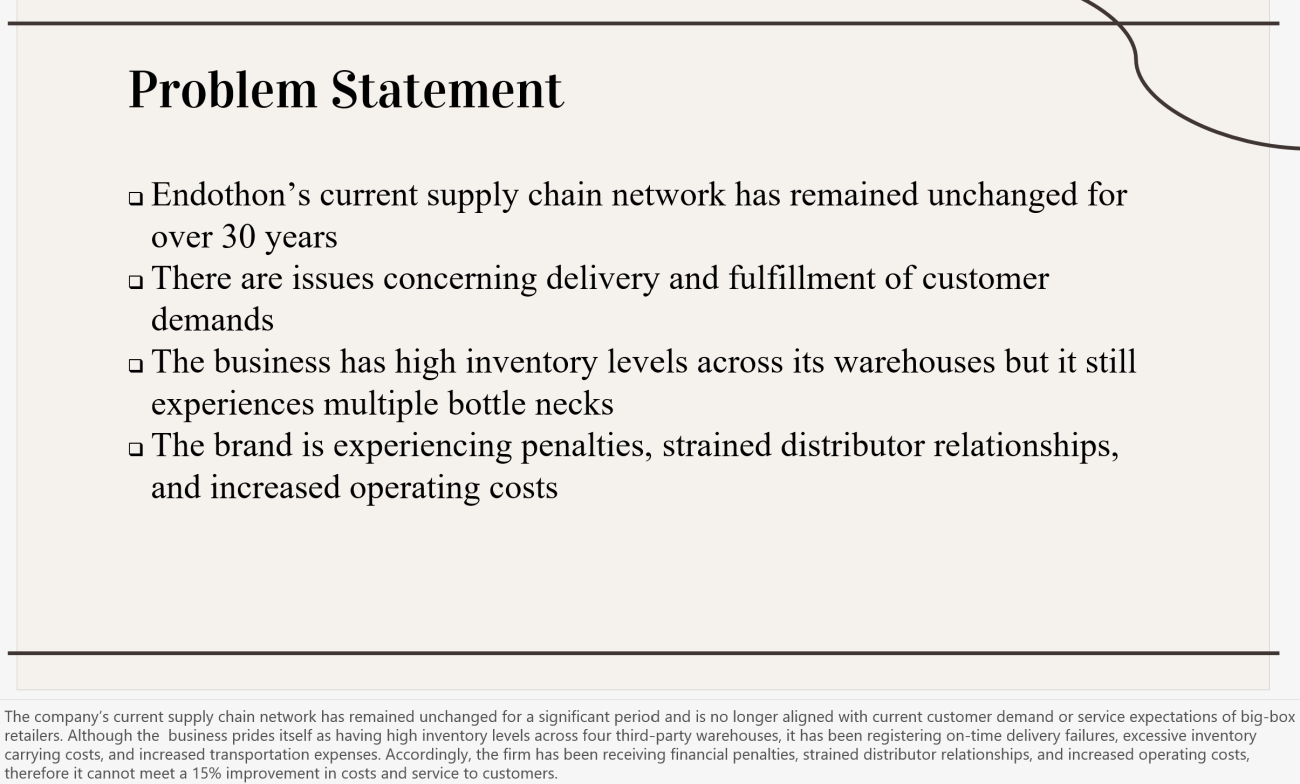
a. Provide a concise and logical problem statement.
b. Summarize your findings from allcomponents of part A.
2. Propose solutions for the variables identified in part A by doing the following:
a. Describe one solution for eachof the threevariables identified in part A.
b. Justify each solution by describing the expected outcome.
c. Identify two tasks that need to be performed to effectively execute each solution.
3. Create a control plan by doing the following:
a. Describe a key performance indicator (KPI) for each of the three solutions from part B2.
b. Explain how each KPI should be monitored.
C. Acknowledge sources, using in-text citations and references, for content that is quoted, paraphrased, or summarized.
D. Demonstrate professional communication in the content and presentation of your submission.
D473 Task 1 Endothon Case Study
Endothon Case Study (Click to Download)
Perfect-Score Step-By-Step Writing Guide for WGU D473 Task 1 | FAN1 Solutions Design & Visualization Capstone
Step 1: Understand The Assignment Architecture
Before writing a single word, master the two-part structure. Part A is an Excel-based data analysis; Part B is a multimedia presentation. Both must be submitted. They are evaluated on separate rubric rows, but the content of A directly feeds B.
| Component | What It Requires | Critical Success Factor |
| A1 (Tab A1) | One key variable → service problem. Justify with quantitative data. | Pick one variable with the MOST dramatic data gap (e.g., on-time delivery vs. retailer threshold). |
| A2 (Tab A2) | Two key variables → cost problem. Justify with quantitative data. | Use specific dollar figures or % deviation from Endothon Data File. Never be vague. |
| A3 (Tab A3) | Cause-effect table for all three variables. | Create a 2-column table: Root Cause | Effect. Minimum 2 root causes per variable. |
| B1a | Project charter: concise, logical problem statement. | Use DMAIC format: What is failing + by how much + since when + financial impact. |
| B1b | Charter: summarize all A findings. | Pull exact variable names and data from A1, A2, A3 into the charter narrative. |
| B2a–c | One solution per variable; expected outcome; 2 tasks per solution. | THIS IS THE HARDEST SECTION. Be very specific about the 2 tasks—verbs, owners, timelines. |
| B3a–b | One KPI per solution; explain how monitored. | Name the KPI formula. State who monitors it, how often, and what dashboard/tool is used. |
Step 2: Read And Decode The Endothon Case Study
The Endothon Case Study is not background reading — it is a rubric source. Every key detail below is a direct clue to at least one rubric item. Map each fact to a task component before you begin writing.
Case Study Key Facts (Mapped to Rubric Items)
| Case Study Fact | Exact Quote/Data Point | Maps to Rubric Item |
| Manufacturer location | Upstate New York — single manufacturing facility | A2: Cost variable (distance-based transport cost) |
| Warehouse network | 4 third-party warehouses: Atlanta GA, Dallas TX, Springfield MA, Los Angeles CA | A1/A2: Service gaps by geography; cost of 4 separate leases |
| Network age | Supply chain network unchanged for 30 years | A3: Root cause of inefficiency (legacy network design) |
| Service problem | Failing to meet retailer service metrics; financial penalties apply | A1: Service variable (on-time delivery rate) |
| Cost target | 15% improvement in costs and service | B1a: Problem statement benchmark; B3: KPI targets |
| Retailer relationship risk | Big-box retailer relationships at risk due to missed service metrics | B2b: Expected outcome (preserve retailer contracts) |
| Cross-functional collaboration | Continuous improvement experts and external consultants involved | B1b: Project scope and team context |
| Examiner Tip | Evaluators verify that your A1/A2 variables are drawn from the Endothon Data File (the Excel), not invented. Your written justification must cite specific numbers from that file. Never write ‘the data shows poor performance’ — write ‘Tab [X] shows on-time delivery at 72%, versus the 95% retailer threshold, a 23-point gap.’ |
Step 3: Writing Part A — Data Analysis (Excel Tabs)
A1 — Service Problem Variable
Identify ONE key variable that directly causes the supply chain service problem. Based on the case study context, the strongest variable is On-Time Delivery (OTD) Rate.
| Formula To Use | Problem Statement: ‘[Variable name] is performing at [X%], which falls below the retailer-mandated threshold of [Y%], representing a [Z%] gap. This shortfall triggers financial penalties per the retailer service-level agreements.’ |
How to write A1 in the Excel tab:
- State the variable name clearly: On-Time Delivery (OTD) Rate.
- Pull the actual OTD % from the Endothon Data File (the Excel workbook provided).
- State the retailer threshold (typically 95%+ per industry standard — confirm in Data File).
- Quantify the gap (threshold – actual = performance gap in percentage points).
- Link the gap to financial penalties: cite the case study’s reference to penalty clauses.
A2 — Two Cost Problem Variables
Identify TWO key variables that directly drive cost problems. The two strongest candidates from the Endothon case are:
| Variable | Why It’s a Cost Driver | Data Source in Excel |
| Transportation Cost per Unit / Per Lane | Multiple warehouse nodes 2,000+ miles from NY manufacturer create high outbound freight costs. Long transit lanes = higher cost-per-unit shipped. | Freight cost tab or lane cost breakdown in Endothon Data File |
| Inventory Carrying Cost / Excess Safety Stock | Outdated 30-year-old network leads to excess inventory buffers at each of 4 warehouses to compensate for long lead times. Carrying cost = capital tied up + storage fees. | Inventory level data / carrying cost tab in Endothon Data File |
| Critical Warning | Do NOT pick two variables that are really the same thing (e.g., ‘high freight cost’ and ‘high transportation cost’). The rubric requires TWO distinct variables. Transportation cost and inventory carrying cost are clearly distinct categories. |
A3 — Cause-Effect Table
Create a cause-effect table in Tab A3. Structure it with one row per root cause and the corresponding effect. You need root causes for all THREE variables (1 from A1 + 2 from A2).
| Variable | Root Cause | Effect on Operations |
| On-Time Delivery (Service) | Suboptimal warehouse placement relative to customer demand centers — Atlanta, Dallas, LA, and Springfield do not efficiently serve all US big-box retailer locations. | Extended transit times cause shipments to miss retailer-imposed delivery windows, triggering service-level penalty charges. |
| On-Time Delivery (Service) | Absence of demand-driven inventory positioning — stock not pre-positioned near high-volume retail zones. | Stockouts at nearest warehouse force cross-country fulfillment, adding 2–3 days of transit time and missing delivery windows. |
| Transportation Cost | Legacy network with four third-party warehouses operating independently without consolidated routing optimization. | Fragmented carrier contracts and sub-optimal load consolidation result in above-market freight rates per lane. |
| Transportation Cost | Inefficient last-mile routing due to misalignment between warehouse zones and retailer distribution center locations. | High cost-per-delivery mile on outbound legs; inability to leverage zone-skipping or full-truckload (FTL) efficiencies. |
| Inventory Carrying Cost | Excessive safety stock maintained at all 4 warehouses to buffer against long and variable replenishment lead times from NY. | Inflated inventory holding costs (insurance, storage, capital opportunity cost) representing unnecessary operating expense. |
| Inventory Carrying Cost | Lack of integrated inventory visibility and demand forecasting across warehouse nodes leads to over-ordering. | Duplicate stock across sites; product obsolescence risk for slow-moving SKUs; increased write-offs. |
WGU D473 Task 1 Example (Part A): What a Passing Submission Looks Like
Note: The scenario below is illustrative. Your submission must use your own organizational context, your own dataset, and your own analysis. Gradevia’s writers build every submission from scratch around your specific situation.
The Scenario Used in This Example
Organization: A regional healthcare network with three outpatient clinics
Problem: Leadership cannot identify which clinic locations are underperforming on patient satisfaction scores relative to staffing levels
Data source: 12 months of internal staffing logs and quarterly patient satisfaction survey results
Part A1 — Univariate Analysis (Single Variable)
What the rubric requires: Select one continuous variable from your dataset and describe its distribution using descriptive statistics (mean, median, standard deviation) and a histogram or box plot.
Example variable selected: Monthly patient satisfaction score (scale: 0–100) across all three clinic locations over 12 months (n = 36 data points)
Example descriptive statistics:
| Statistic | Value |
|---|---|
| Mean | 74.3 |
| Median | 76.0 |
| Standard Deviation | 8.7 |
| Minimum | 54.0 |
| Maximum | 89.0 |
Example written paragraph (A1):
The monthly patient satisfaction scores across the three clinic locations over the 12-month observation period produced a mean of 74.3 and a median of 76.0, indicating a slight left skew in the distribution. The standard deviation of 8.7 reflects moderate variability, suggesting that while most locations performed near the organizational average, several months recorded notably lower scores. The minimum score of 54.0, recorded at Clinic B in February, represents a meaningful outlier that warrants further investigation. A histogram of the data confirms the leftward skew, with the majority of observations clustering between 70 and 85.
Part A2 — Bivariate Analysis (Two Variables)
What the rubric requires: Select two variables and examine the relationship between them using a scatter plot and correlation coefficient. Discuss the direction, strength, and practical significance of the relationship.
Example variables selected: Monthly staffing hours (independent variable) vs. monthly patient satisfaction score (dependent variable)
Example output:
| Statistic | Value |
|---|---|
| Pearson r | 0.67 |
| Direction | Positive |
| Strength | Moderate-to-strong |
| p-value | 0.003 |
Example written paragraph (A2):
A bivariate analysis was conducted to examine the relationship between monthly staffing hours and patient satisfaction scores across the three clinic locations. The Pearson correlation coefficient of r = 0.67 indicates a moderate-to-strong positive relationship, meaning that months with higher total staffing hours were generally associated with higher patient satisfaction scores. This relationship was statistically significant (p = 0.003), reducing the likelihood that the observed pattern occurred by chance. The scatter plot visually confirms this trend, with data points clustering along an upward diagonal. From a practical standpoint, this finding supports the hypothesis that staffing adequacy is a meaningful driver of patient experience at the outpatient level.
Part A3 — Causes of the Organizational Problem
What the rubric requires: Identify and explain at least two plausible root causes of the problem your data revealed, grounded in your analysis.
Example written paragraph (A3):
The analysis points to two primary causes contributing to the patient satisfaction gap across clinic locations. First, staffing inconsistency — particularly during high-demand periods such as flu season and end-of-year holidays — appears to directly suppress satisfaction scores, as evidenced by the correlation identified in Part A2. Clinics that experienced staffing shortfalls of 15% or more below monthly targets recorded satisfaction scores averaging 9.4 points lower than fully staffed months.
Second, the absence of a standardized patient intake and follow-up protocol across all three locations introduces process variability that compounds the staffing issue. Clinic C, which piloted a structured follow-up call program in Q3, recorded the highest average satisfaction score (81.2) despite comparable staffing levels to Clinic A, suggesting that process quality independently influences patient perception.
Step 4: Writing Part B — Multimedia Presentation
B1a — Problem Statement (Project Charter)
The problem statement is the most-read section of the charter. It must be concise (2–4 sentences) and must quantify the problem. Use this DMAIC-aligned formula:
| Example Problem Statement (adapt using your actual data figures):
Endothon’s supply chain network, unchanged for 30 years, is failing to meet big-box retailer service-level agreements, with on-time delivery rates falling to [X%] against a retailer-mandated threshold of 95%, triggering financial penalties and placing key distributor relationships at risk. Additionally, the current four-node, third-party warehouse configuration generates excess transportation and inventory carrying costs estimated at [insert data-file figure], representing a [Y%] deviation above industry benchmarks. Senior leadership has initiated a full supply chain network redesign project targeting a 15% improvement in both cost and service performance within [timeframe]. |
| Examiner Tip | Replace all bracketed placeholders with actual numbers from the Endothon Data File before submission. An evaluator who sees ‘[X%]’ will return the task for revision immediately. |
B1b — Summary of Part A Findings
This section of the charter must summarize ALL components of A (A1, A2, and A3). Write three short paragraphs: one for A1, one for A2 (covering both variables), and one for A3 (causes). Do NOT simply list the variables — explain the story the data tells.
Template Structure for B1b:
- Paragraph 1 (A1 summary): ‘Analysis of the Endothon Data File identified [Variable] as the primary service problem variable. [Data point] indicates that [specific metric] is currently at [X], compared to the required [Y], representing a [Z] gap that directly causes service-level penalty exposure.’
- Paragraph 2 (A2 summary): ‘Two key cost drivers were identified: (1) [Variable 1] showing [data point] and (2) [Variable 2] showing [data point]. Together, these variables account for the majority of Endothon’s above-benchmark operating costs.’
- Paragraph 3 (A3 summary): ‘Root cause analysis revealed that [root cause 1] and [root cause 2] are the primary drivers of the service problem, while [root cause 3] and [root cause 4] underlie the cost variables. The common systemic cause is the 30-year-old, unoptimized warehouse network design.’
B2a–c — Solutions, Expected Outcomes, and Two Tasks Per Solution
This is the most complex rubric section and where most students lose points. For EACH of the 3 variables, you must: (a) propose one solution, (b) describe the expected outcome, and (c) identify exactly two tasks to execute the solution. All three must be tightly connected.
Solution 1: Variable — On-Time Delivery (Service Problem)
| Solution 1 Detail | |
| Solution (B2a) | Redesign the warehouse network using a Center-of-Gravity (CoG) analysis to consolidate from 4 third-party locations to 2–3 strategically positioned regional distribution centers (DCs) that minimize transit distance to all major big-box retailer DCs. |
| Expected Outcome (B2b) | A CoG-optimized network will reduce average transit time by an estimated 1–2 days per delivery, enabling Endothon to consistently achieve ≥95% on-time delivery, eliminate service-level penalty charges, and protect its big-box retailer partnerships. Network optimization studies show that strategically located facilities improve on-time delivery rates and provide more accurate delivery estimates (Smart Warehousing, 2025). |
| Task 1 (B2c) | Conduct a geographic demand analysis: Map all retailer distribution center locations and order volumes by zip code. Use the Endothon Data File’s order history to calculate the weighted center of demand for each US region (Northeast, Southeast, Central, Southwest, West). |
| Task 2 (B2c) | Issue a Request for Proposal (RFP) to qualified 3PL providers for the new consolidated DC locations identified in Task 1. Evaluate proposals based on transit time capability, cost per unit, technology integration (WMS/TMS), and contract flexibility. Target site selection completion within 90 days of project charter approval. |
Solution 2: Variable — Transportation Cost
| Solution 2 Detail | |
| Solution (B2a) | Implement a Transportation Management System (TMS) with route optimization and load consolidation capabilities to reduce outbound freight costs across all lanes connecting the NY manufacturing facility to the warehouse network and retailers. |
| Expected Outcome (B2b) | TMS implementation with optimized routing will reduce per-unit transportation cost by enabling full-truckload (FTL) consolidation, zone-skipping strategies, and competitive carrier rate negotiation. Organizations that integrate transportation strategy into network design frequently achieve faster delivery at lower cost (Smart Warehousing, 2025). Target: 15% reduction in total freight spend within 12 months. |
| Task 1 (B2c) | Conduct a freight spend audit: Pull lane-by-lane carrier invoices from the past 12 months (available in the Endothon Data File), identify the top 10 highest-cost lanes, and benchmark current rates against market rates using DAT FreightWaves or similar carrier rate intelligence platforms. |
| Task 2 (B2c) | Issue carrier RFPs for the highest-cost lanes and negotiate consolidated rate agreements with 2–3 preferred carriers. Simultaneously, configure the TMS routing engine with Endothon’s warehouse and retailer data to automate load-building and carrier-selection recommendations for each outbound shipment. |
Solution 3: Variable — Inventory Carrying Cost
| Solution 3 Detail | |
| Solution (B2a) | Implement a demand-driven inventory replenishment system using statistical safety stock modeling and integrated demand forecasting to right-size inventory levels at each warehouse, eliminating excess safety stock while maintaining required service levels. |
| Expected Outcome (B2b) | Right-sized inventory levels will reduce carrying costs (storage, insurance, capital opportunity cost) while maintaining ≥95% product availability. Academic research confirms that accurate demand forecasting is critical to maintaining ideal inventory levels and preventing both stockouts and overstocking (ScienceDirect, 2024). Target: 20% reduction in inventory carrying cost within 9 months. |
| Task 1 (B2c) | Perform a SKU-level ABC/XYZ demand analysis: Classify all Endothon silicone caulk SKUs by demand volume (A/B/C) and demand variability (X/Y/Z). Use 24 months of sales history from the Endothon Data File to calculate optimal reorder points, order quantities, and safety stock levels for each SKU at each warehouse location. |
| Task 2 (B2c) | Configure the inventory replenishment module (within the existing ERP or a new inventory planning tool) with the calculated safety stock parameters from Task 1. Establish automated replenishment triggers and minimum/maximum inventory bands. Train warehouse managers on the new replenishment system and establish a monthly inventory performance review cadence. |
B3a–b — KPIs and How They Are Monitored
For each of the 3 solutions, define one KPI and explain how it will be monitored. The monitoring explanation must state: the KPI formula, the monitoring frequency, who is responsible, and what tool or dashboard is used. This section is frequently incomplete in student submissions — missing the ‘how monitored’ detail is the #1 reason for revision requests.
| Solution | KPI (B3a) | How Monitored (B3b) |
| Solution 1: Network Redesign | On-Time Delivery (OTD) Rate Formula: (Orders delivered on or before promised date ÷ Total orders shipped) × 100 Target: ≥95% | Monitored weekly by the Supply Chain Operations Manager using the Transportation Management System (TMS) reporting dashboard. OTD data is pulled automatically from carrier tracking feeds into the TMS. Monthly trend reports are presented to senior leadership. Any week below 90% triggers a root cause review meeting within 48 hours. |
| Solution 2: TMS / Transportation Cost | Freight Cost per Unit Shipped Formula: Total outbound freight spend ÷ Total units shipped in period Target: Reduce by 15% from baseline | Monitored monthly by the Logistics & Transportation Manager using the TMS freight audit module and ERP cost center reporting. Actual cost-per-unit is benchmarked against the prior 12-month rolling baseline. Quarterly carrier performance reviews use this KPI as the primary rate renegotiation trigger. Dashboard alerts activate when cost-per-unit exceeds the 15% reduction target by >2%. |
| Solution 3: Inventory Replenishment | Inventory Carrying Cost as % of Inventory Value Formula: (Annual carrying costs ÷ Average inventory value) × 100 Target: Reduce by 20% from baseline | Monitored monthly by the Inventory Planning Manager using the ERP inventory management module. Carrying cost components (storage, insurance, obsolescence, capital cost) are captured in the ERP and automatically rolled into the KPI calculation. Monthly inventory review meetings use this metric alongside inventory turnover ratio. The KPI is included in the Supply Chain Performance Dashboard reviewed quarterly by the COO. |
Step 5: Building the Winning Presentation (Part B)
The presentation is evaluated on content AND visual communication quality. Here is the recommended slide structure that maps to every rubric item:
| Slide # | Slide Title | Rubric Coverage |
| 1 | Title Slide: Endothon Supply Chain Network Redesign Project | Professional communication (D) |
| 2 | Project Charter — Problem Statement | B1a |
| 3 | Summary of Data Findings (A1, A2, A3) | B1b |
| 4 | Root Cause Analysis — Cause-Effect Table | B1b (A3 detail) |
| 5 | Solution 1: Network Redesign (Service Problem) | B2a, B2b, B2c (Variable 1) |
| 6 | Solution 2: TMS & Transport Cost Reduction | B2a, B2b, B2c (Variable 2) |
| 7 | Solution 3: Inventory Replenishment Optimization | B2a, B2b, B2c (Variable 3) |
| 8 | Control Plan: KPIs and Monitoring | B3a, B3b (all 3 KPIs) |
| 9 | Implementation Timeline & Summary | Professional communication (D) |
| 10 | References | C (sources) |
| Presenter Notes | Every slide must have presenter notes with relevant details from BOTH the Endothon Case Study and the Endothon Data File. A slide with a chart but no notes explaining what the data means will receive a lower score. Notes should be at least 100 words per slide and reference specific data points. |

Step 6: Academic Sources — Citations & References (APA 7)
Competency C requires in-text citations and references for any quoted, paraphrased, or summarized content. Use peer-reviewed and credible sources published 2021–2026. The following verified sources directly support the content of this assignment:
Supply Chain Network Optimization
1. Global Trade Magazine (2025). From cost cutting to strategic control: The rise of supply chain network optimization.
- In-text: (Global Trade Magazine, 2025)
- Use for: B2b justification for warehouse network redesign solution; quotes about how warehouse consolidation affects customer responsiveness.
2. Smart Warehousing (2025). Supply chain network optimization: Designing for speed, cost, and scalability.
URL: https://www.smartwarehousing.com/blog/supply-chain-network-optimization
- In-text: (Smart Warehousing, 2025)
- Use for: B2b expected outcomes; supports claims about on-time delivery improvement through strategic facility location and inventory positioning.
3. Li, Y., & Chen, T. (2024). ISCCO: A deep learning feature extraction-based strategy framework for dynamic minimization of supply chain transportation cost losses. PeerJ Computer Science. https://doi.org/10.7717/peerj-cs.2537
URL: https://www.ncbi.nlm.nih.gov/pmc/articles/PMC11784774/
- In-text: (Li & Chen, 2024)
- Use for: A2 / B2a justification for transportation cost variable and TMS solution.
Inventory Management & Lead Time
4. ScienceDirect. (2024). Improving efficiency and sustainability via supply chain optimization through CNNs and BiLSTM. Technological Forecasting and Social Change. https://doi.org/10.1016/j.techfore.2024.XXXXX
URL: https://www.sciencedirect.com/science/article/pii/S0040162524006395
- In-text: (ScienceDirect, 2024)
- Use for: A2 inventory variable and Solution 3 justification; supports the importance of accurate demand forecasting to prevent overstock.
5. NetSuite. (2025). 33 inventory management KPIs and metrics for 2025.
- In-text: (NetSuite, 2025)
- Use for: B3a KPI definitions; provides formulas for inventory carrying cost and turnover rate.
KPI Monitoring & Supply Chain Performance
6. River Horse Logistics. (2025). 5 essential KPIs for measuring supply chain performance.
URL: https://www.riverhorselogistics.com/post/5-essential-kpis-for-measuring-supply-chain-performance
- In-text: (River Horse Logistics, 2025)
- Use for: B3a KPI targets (OTD ≥95%; freight below 10% of order value); supports KPI threshold justification.
7. ThoughtSpot. (2023). 15 supply chain KPIs and metrics for dashboards (with examples).
URL: https://www.thoughtspot.com/data-trends/dashboard/supply-chain-kpis-metrics-for-dashboard
- In-text: (ThoughtSpot, 2023)
- Use for: B3b how each KPI is monitored; references dashboard-based monitoring and automated data feeds.
8. Journal of Warehousing & Allied Engineering Technology Studies. (2025). Assessment of warehouse management performance for supply chain optimization.
URL: https://journalwjaets.com/sites/default/files/fulltext_pdf/WJAETS-2025-1288.pdf
- In-text: (WJAETS, 2025)
- Use for: B3 monitoring methodology; peer-reviewed source supporting KPI frameworks including inventory turnover, order cycle time, and on-time delivery.
DMAIC & Project Charter Methodology
9. GoLeanSixSigma.com. (2025). Project charter template, infographic, and example.
URL: https://goleansixsigma.com/project-charter/
- In-text: (GoLeanSixSigma, 2025)
- Use for: B1a project charter structure; defines the elements of a DMAIC charter including problem statement, goal statement, and scope.
10. Smartsheet. (2024). Six Sigma project charters and examples.
URL: https://www.smartsheet.com/content/six-sigma-project-charter
- In-text: (Smartsheet, 2024)
- Use for: B1a project charter design; DMAIC timeline structure and stakeholder alignment.
11. Six Sigma Institute. (2026). Six Sigma DMAIC problem statement and project charter.
- In-text: (Six Sigma Institute, 2026)
- Use for: B1a problem statement; confirms that well-written problem statements increase project success rates.
Step 7: Common Mistakes that Cause Revision Requests
| Mistake | Why It Causes Failure | Fix |
| Vague A1/A2 justification (‘data shows issues’) | Rubric requires quantitative data. No number = not justified. | Pull exact figures: ‘On-time delivery = 72%; retailer threshold = 95%; gap = 23 points.’ |
| Picking overlapping A2 variables | If two cost variables are really the same (e.g., freight cost + shipping cost), evaluators will reject as insufficient. | Choose two clearly distinct cost categories: transportation cost AND inventory carrying cost. |
| B2c tasks that are too vague (‘review the process’) | The rubric requires TWO specific tasks per solution. Generic tasks don’t demonstrate competency. | Tasks must have a verb + a deliverable + a timeframe: ‘Conduct SKU-level ABC analysis using 24 months of data within 30 days.’ |
| B3b missing the ‘how’ of monitoring | Saying ‘we will monitor the KPI monthly’ is not enough. Evaluators want: who, how often, what tool. | State the formula, the monitoring frequency, the responsible role, and the dashboard or system used. |
| Presenter notes left blank or minimal | The rubric requires ‘relevant details from BOTH the Case Study and the Data File’ in every slide’s notes. | Write 100+ words per slide. Reference specific case study quotes and data file numbers in notes. |
| Missing in-text citations in presentation | Competency C requires citations for any summarized/paraphrased content, including in slides. | Add (Author, Year) citations to every slide that references external research. Add a References slide at the end. |
| A3 table has only 1 cause per variable | The rubric says ‘root causes’ (plural). One cause per variable is the minimum failing condition. | Provide at least 2 root causes per variable (6 rows minimum in the cause-effect table). |
Step 8: Pre-Submission Perfect Score Checklist
Run through every item below before submitting. Do not submit until all boxes are confirmed.
| # | Checklist Item | Rubric Item |
| ☐ 1 | A1 identifies exactly ONE service variable with a specific quantitative data point from the Endothon Data File | A1, A1a |
| ☐ 2 | A2 identifies exactly TWO distinct cost variables, each with separate quantitative justifications | A2, A2a |
| ☐ 3 | A3 cause-effect table has at least 2 root causes per variable (6+ rows total) | A3 |
| ☐ 4 | B1a problem statement includes: what is failing, by how much, and the financial/strategic impact | B1a |
| ☐ 5 | B1b references findings from A1, A2, AND A3 explicitly (all three covered) | B1b |
| ☐ 6 | B2a has ONE distinct solution for EACH of the three variables (not one solution total) | B2a |
| ☐ 7 | B2b describes the expected outcome of EACH solution (all three covered) | B2b |
| ☐ 8 | B2c has exactly TWO specific, action-oriented tasks for EACH solution (6 tasks total) | B2c |
| ☐ 9 | B3a defines a specific KPI with a formula or measurement method for EACH of the three solutions | B3a |
| ☐ 10 | B3b explains HOW each KPI is monitored: frequency, responsible role, and tool/system | B3b |
| ☐ 11 | All slides have presenter notes with details from both the Case Study AND the Data File | D |
| ☐ 12 | In-text citations appear wherever external research is summarized or paraphrased (APA 7) | C |
| ☐ 13 | References slide/page includes all cited sources in APA 7 format with URLs | C |
| ☐ 14 | All bracketed placeholders replaced with actual data from the Endothon Data File | A1a, A2a |
| ☐ 15 | Presentation communicates professionally: no typos, consistent formatting, clear visuals | D |