
Blog
Linear Regression Analysis for WGU C207 Task 1: When It Fits, What It Assumes, and Its Limits

Updated on: Oct 19, 2026
By Dan Palmer, MBA · Academic strategy consultant for working adult learners · LinkedIn
Excel will run a regression on almost any two columns of numbers. Whether it should is the question behind three parts of WGU C207 Task 1 (QUM3, Linear Regression Analysis). A3 asks you to justify why linear regression is the appropriate technique. B1 asks for the level of measurement of each variable. D2 asks for a limitation that could affect your recommendation. All three depend on understanding the method, not on reading the output.
This page covers those concepts for working adults in Data-Driven Decision Making who can run the analysis but want to explain it well. It isn’t the full Task 1 walkthrough. For every part of the task and a complete worked example, start with our WGU C207 Task 1 guide and example.
WGU C207 Task 1 Assignment – Linear Regression Analysis
Introduction
Managers are required to organize, interpret, and display data that is reliable and relevant to the real-world decisions they must make in their businesses. The use of analytical tools will improve your ability to use data to make these informed decisions.
In this task, you will address the business situation in the attached “Linear Regression Analysis Resources” scenario. You will access the scenario and dataset by entering your student ID number in the “Start” tab of the attachment, then continuing to the “Scenario” tab. Using this data set, you will perform a linear regression analysis and write a report in which you recommend a solution by summarizing the key details of your analysis.
For full functionality of the scenario and dataset attachment, you are strongly encouraged to use Microsoft Excel, which is available via the Microsoft Office 365 subscription service provided to all WGU students. It can be downloaded using the “Microsoft Office 365” link in the Web Links section.
Scenario
Refer to the scenario located in the attached “Linear Regression Analysis Resources.”
Requirements
Your submission must represent your original work and understanding of the course material. Most performance assessment submissions are automatically scanned through the WGU similarity checker. Students are strongly encouraged to wait for the similarity report to generate after uploading their work and then review it to ensure Academic Authenticity guidelines are met before submitting the file for evaluation. See Understanding Similarity Reports for more information.
Grammarly Note:
Professional Communication will be automatically assessed through Grammarly for Education in most performance assessments before a student submits work for evaluation. Students are strongly encouraged to review the Grammarly for Education feedback prior to submitting work for evaluation, as the overall submission will not pass without this aspect passing. See Use Grammarly for Education Effectively for more information.
Microsoft Files Note:
Write your paper in Microsoft Word (.doc or .docx) unless another Microsoft product, or pdf, is specified in the task directions. Tasks may notbe submitted as cloud links, such as links to Google Docs, Google Slides, OneDrive, etc. All supporting documentation, such as screenshots and proof of experience, should be collected in a pdf file and submitted separately from the main file. For more information, please see Computer System and Technology Requirements.
You must use the rubric to direct the creation of your submission because it provides detailed criteria that will be used to evaluate your work. Each requirement below may be evaluated by more than one rubric aspect. The rubric aspect titles may contain hyperlinks to relevant portions of the course.
Complete your linear regression analysis and create a report by doing the following:
Note: The supporting document “Linear Regression Analysis Resources” contains a scenario, data set, and data analysis template. While you must use the scenario and data set provided in the supporting document, the template is optional. You are encouraged to use the template to complete your
analysis. Please see supporting document, “QUM Task 1 Getting Started,” for help accessing the scenario and dataset.
A. Summarize the business scenario by doing the following:
- Describe a business question that could be answered by applying linear regression analysis and is derived from the scenario in the attached “Linear Regression Analysis “
- State the null hypothesis for this linear regression
- Using relevant details from the scenario, the business question you proposed in part A1, and the null hypothesis you stated in part A2, justify why linear regression is the appropriate analysis
B. Describe the data provided in the attached “Linear Regression Analysis Resources” by doing the following:
- Describe the relevant data characteristics for your linear regression analysis, including each of the following:
- independent variable or variables
- dependent variable
- level of measurement for each variable
- sample size or number of observations
C. Report how you analyzed the data using linear regression by doing the following:
- Provide the output and calculations of the linear regression analysis you
Note: The output should include the output from the software you used to perform the analysis. Refer to “Prepare for the Performance Assessment Task 1” in the course of study to see examples of acceptable output.
- Create a graphical display of the data using a scatter plot that includes each of the following:
- chart title
- legend
- axis titles
Note: This display should be a summary or representation of the data provided, not raw data.
D. Describe the implications of your data analysis from the scenario by doing the following:
- Interpret the results of the data analysis by doing the following:
a. Discuss the goodness of fit with the supporting test statistic from your linear regression analysis
b. Discuss the significance of the independent variable(s) with support from your linear regression analysis results.
c. Create the linear equation, then describe how it can be applied to the scenario in future business decision-making.
2. Discuss a limitation of the research that could affect the recommended course of
3. Recommend a course of action that aligns with your linear regression analysis
Note: Your recommendation should focus on the results of your analytic technique output from part C1.
E. Acknowledge sources, using in-text citations and references, for content that is quoted, paraphrased, or
F. Demonstrate professional communication in the content and presentation of your submission
Where These Concepts Show Up in QUM3 Task 1
| Prompt | What it asks | The concept behind it |
|---|---|---|
| A3 | Justify why linear regression is appropriate, using the scenario, your business question, and your null hypothesis | When regression fits a question |
| B1 | Independent and dependent variables, the level of measurement for each, and the sample size | Levels of measurement |
| C2 and D1 | A scatter plot, then goodness of fit and significance | The assumptions behind trusting those numbers |
| D2 | A limitation that could affect the recommended course of action | What regression can and can’t show |
For the other parts, see our guides to running the regression in Excel, interpreting your output, and writing the null hypothesis.
When Linear Regression Is the Right Technique (A3)
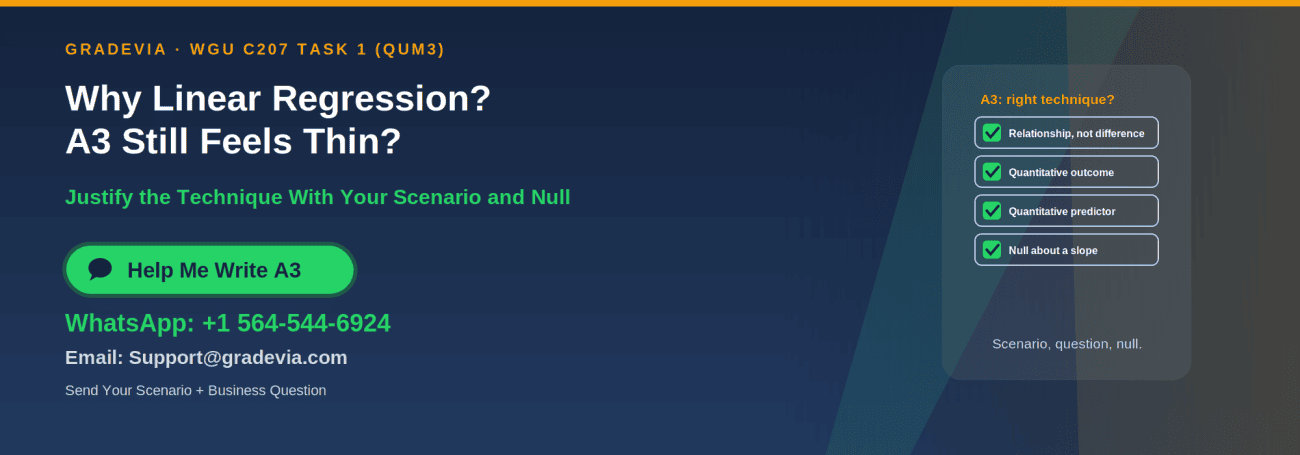
Linear regression fits a business question when all four of these hold:
| Check | What it means for your scenario |
|---|---|
| The question is about a relationship or prediction | “Does X predict Y?” rather than “Is group A different from group B?” |
| The dependent variable is quantitative | Something measured on a numeric scale, such as sales, hours, or a score |
| The independent variable(s) are quantitative | The predictor is also numeric in this task |
| The null hypothesis concerns a slope | H₀: β₁ = 0, no linear relationship |
A3’s prompt asks you to use three things: relevant details from the scenario, your A1 business question, and your A2 null hypothesis. A strong justification names the two variables, says why the question is about a relationship between quantities, and connects the null hypothesis to what regression tests. It can also note that regression produces an equation the business can use, which sets up D1c.
Vague A3: “Linear regression is appropriate because it shows relationships between variables.”
Specific A3: Names the scenario’s variables, explains that both are quantitative, ties the slope test to your null hypothesis, and says how the equation would help this business decide something.
Levels of Measurement (B1)
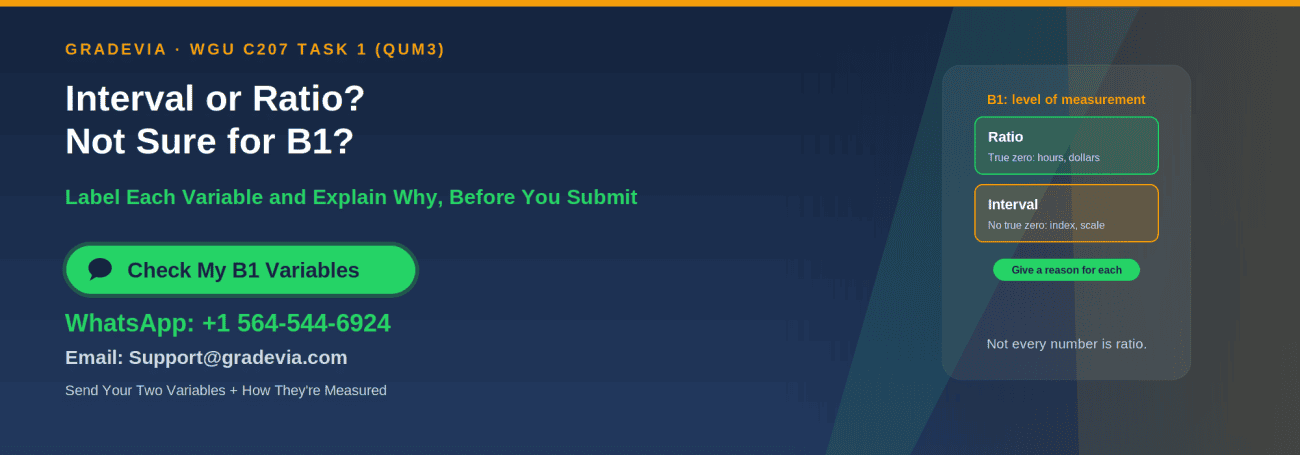
B1 asks for the level of measurement of each variable. The four levels are nominal, ordinal, interval, and ratio, and the difference between the last two is whether the variable has a true zero (Holmes et al., 2017):
| Level | What it means | Business examples |
|---|---|---|
| Nominal | Categories with no order | Region, product line, yes/no |
| Ordinal | Ranked categories without measurable gaps | “Poor, fair, good, excellent” ratings |
| Interval | Meaningful differences, no true zero | Many indexes and survey scales, temperature in Fahrenheit |
| Ratio | Meaningful differences and a true zero | Dollars, units sold, hours, counts, percentages of a total |
Most C207 variables are ratio level: revenue, units, hours, and counts all have a true zero. But not every number is ratio. A satisfaction index built from survey ratings, where 0 is simply the bottom of the scale, is usually treated as interval. Decide from what the variable measures, and give a one sentence reason for each label.
The Assumptions Behind a Regression
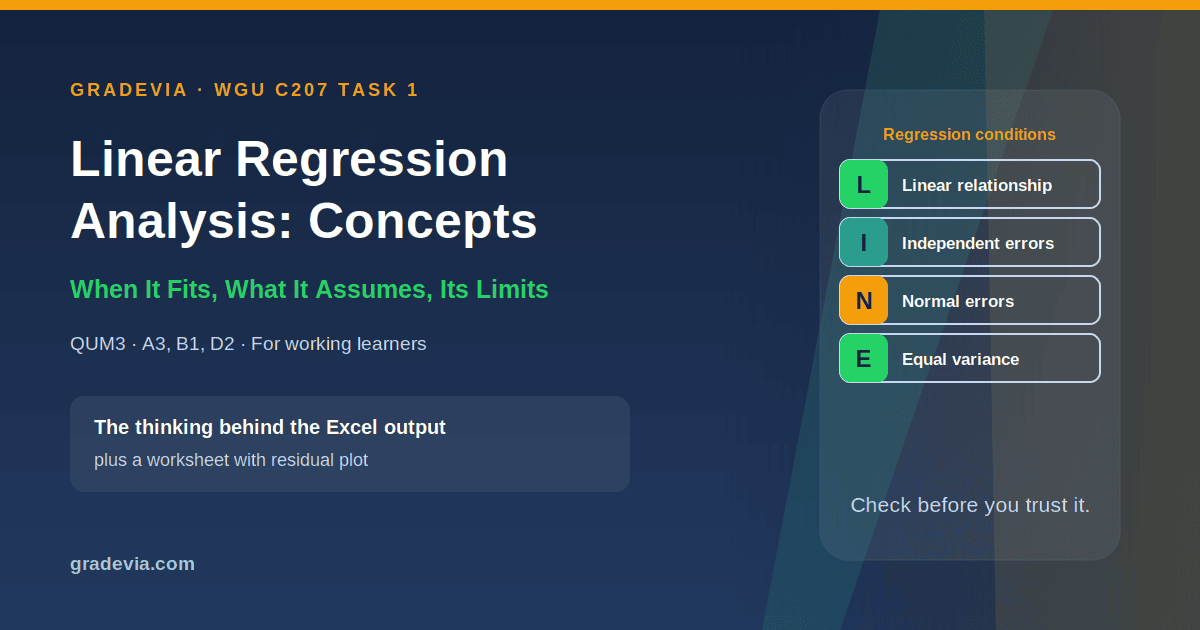
Simple linear regression rests on four conditions, often remembered as LINE (Penn State Eberly College of Science, n.d.):
| Condition | What it means | A quick check |
|---|---|---|
| Linear | The average of Y changes in a straight line with X | Your C2 scatter plot shows a straight, not curved, pattern |
| Independent errors | One observation’s error doesn’t influence another’s | Each observation is a separate unit or period |
| Normal errors | The errors are roughly normally distributed | A histogram of residuals looks roughly bell shaped |
| Equal variance | The spread of errors is similar across the range of X | A residual plot shows no funnel shape |
C207 Task 1 doesn’t ask you to test these formally. But a scatter plot with a clear curve, or a few extreme outliers, is worth mentioning, because it affects how much weight your recommendation can carry. Excel’s Regression tool can produce residual plots if you tick “Residual Plots” in the dialog box.
What Regression Can’t Show: Choosing a D2 Limitation
D2 asks for a limitation that “could affect the recommended course of action.” The strongest limitations come from the method and the data, not from general statements like “more data would help”:
| Limitation | Why it matters for a recommendation |
|---|---|
| Association, not causation | A significant slope shows the variables move together, not that changing X will change Y. Other factors may drive both |
| Range of the data | The equation is reliable only within the range of X you observed; predicting beyond it is extrapolation |
| One time period or sample | Results from one period may not hold in another, such as a different season |
| One predictor | Y usually depends on more than one factor, and the model leaves the others out |
| Outliers | A few extreme points can pull the line and inflate or weaken R² |
Then say how the limitation could affect your D3 recommendation. That link is what makes a limitation relevant rather than generic.
Linear Regression Analysis Example: Brookline Home Services
Our linear regression analysis example is a five page concepts worksheet for Brookline Home Services, a fictitious heating and cooling company, using fictitious data generated for this page. It asks whether average response time predicts customer satisfaction across 40 service regions. It includes:
- An A3 checklist and a model A3 paragraph
- A B1 table with a reason for each level of measurement, including why a satisfaction index is interval, not ratio
- A scatter plot and a residual plot, with each LINE condition checked in plain language
- A table of four possible D2 limitations and a model D2 paragraph that links the limitation to the recommendation
- Comments explaining what each part does
Here’s part of its B1 reasoning:
Interval: differences are meaningful, but a score of 0 is the bottom of a survey scale rather than a true absence, so 80 is not “twice as satisfied” as 40.
Your scenario and dataset are generated from your own student ID, so your variables and results will be different. This worksheet complements the full example on our main C207 Task 1 guide, which covers every part of the report.
Download the linear regression concepts worksheet (.docx)
Checklist for A3, B1, and D2
- A3 names both variables and explains why the question is about a relationship between quantities
- A3 uses the scenario, your business question, and your null hypothesis
- B1 gives the level of measurement for each variable, with a reason
- B1 states the sample size as the number of observations
- Your scatter plot was checked for curves and extreme outliers
- D2 names one specific limitation and explains how it could affect your recommendation
Related C207 Resources
- Our WGU C207 Task 1 guide and example walks through every part of the task with a complete example.
- Our guides to running the regression in Excel, interpreting your output, and writing the null hypothesis cover the other parts.
- For Task 2, see our WGU C207 Task 2 guide.
- Browse all of our C207 guides.
Frequently Asked Questions
What is linear regression analysis in WGU C207 Task 1?
It’s the technique QUM3 Task 1 asks you to use: estimating a straight line that relates an independent variable to a dependent variable in your scenario’s dataset, testing whether its slope is significantly different from zero, and using the results to recommend a business decision.
How do I justify linear regression in A3?
Show that your business question is about a relationship between quantitative variables, name those variables from your scenario, and connect your null hypothesis (the slope is zero) to what regression tests.
Are all numeric variables ratio level?
No. Ratio variables have a true zero, such as dollars or hours. Some numeric variables, such as indexes built from survey ratings, have no true zero and are usually treated as interval.
Do I need to test regression assumptions for C207 Task 1?
The directions don’t ask for formal tests. Checking your scatter plot for curves or outliers is still worthwhile, because problems there can make a good D2 limitation.
What’s a good limitation for D2?
One tied to the method or the data, such as association not proving causation, or predictions being unreliable outside the range of your data, with a sentence on how it could affect your recommendation.
Can I use the Brookline Home Services worksheet in my submission?
No. Its company and data are fictitious, and your scenario and dataset are generated from your own student ID. It’s for illustration only.
Want a Second Look Before You Submit?
If you’re working full time and want structured assignment support justifying linear regression in A3, labeling your variables in B1, or choosing a D2 limitation that connects to your recommendation, message Gradevia on WhatsApp at +1 564 544 6924 or email Support@gradevia.com.
Sources
Holmes, A., Illowsky, B., & Dean, S. (2017). Introductory business statistics. OpenStax. https://openstax.org/books/introductory-business-statistics/pages/1-3-levels-of-measurement
Penn State Eberly College of Science. (n.d.). 4.1: Background. STAT 501: Regression methods. https://online.stat.psu.edu/stat501/lesson/4/4.1