WGU KAM4 C219 Task 2: Business Analysis Report Help— Expert Guide, Tips, and Sample for Healthcare Management Students

Assignment Instructions and Rubric
WGU KAM4 C219 Task 2: Business Analysis Report Instructions
Business Analysis Template
WGU KAM4 C219 Task 2: Business Analysis Report Help
| QUICK SUMMARY
KAM4 C219 Task 2 requires a board-level Business Analysis Report grounded in six quarters of simulation data. This guide deconstructs every rubric section — strategic thrusts, valuation methodology, financial ratio analysis, cash flow interpretation, and conscious scorecard decisions — with the precision WGU evaluators expect. If you have already completed the simulation and need a passing, rubric-aligned paper, we provide custom-written C219 capstone reports tailored to your actual simulation outputs. |
What KAM4 C219 Task 2 Actually Tests — And Why Most Students Struggle
KAM4 C219 Task 2 is not a standard reflective essay. It is a formal analytical document addressed to a board of directors and an investor audience, built entirely on data your business simulation generated across Q1 through Q6. The distinction matters because WGU evaluators score against a rubric that rewards specificity: you cannot write in generalities about “market conditions” or “strategic alignment” and expect a Competent rating.
The task sits within WGU’s C219 MBA Healthcare Management Capstone (formerly structured as part of the KAM series), and it tests whether you can integrate graduate-level competencies — financial analysis, strategic planning, leadership decision-making — in one cohesive deliverable. The evaluation criteria under Competency 981.1.8 explicitly requires integration across your degree program, meaning evaluators are reading for command of the subject, not just compliance with formatting.
Three patterns consistently push students to Approaching Competence rather than Competent:
- Selecting strategic thrusts that were not documented in Q6 > Strategic Planning > Goals and Strategy, making the connection to business decisions unverifiable.
- Using a valuation methodology without disclosing the assumptions, resulting in a calculation that evaluators cannot reproduce or validate.
- Treating the conscious scorecard section as a summary of what happened rather than a causal analysis of how decisions drove measurable outcomes.
This guide addresses each section of the rubric with the same rigor the task demands.
A1 — Corporate Strategic Thrusts: How to Write the Connection Correctly
The rubric for A1 is precise: four strategic thrusts selected from the simulation, each linked to one distinct business decision, with an explanation of the causal relationship between them. The most common failure at this section is treating thrusts and decisions as interchangeable — listing what you did without articulating why the thrust directed that specific choice.
A strategic thrust is a directional commitment — growth through innovation, operational efficiency, customer-focused differentiation, market expansion. A business decision is a discrete, simulation-documented action: a pricing change in Q3, a specific R&D investment in Q4, a headcount decision in Q2. The explanation must connect the two with directional logic, not correlation.
Rubric-Compliant Structure for Each Thrust Entry
| Component | What WGU Evaluators Expect |
| Strategic Thrust | Exact wording from Q6 > Strategic Planning > Goals and Strategy |
| Business Decision | A specific, simulation-traceable action with quarter reference |
| Causal Explanation | Why the thrust logically necessitated or shaped that decision — not a description of both in isolation |
| Distinction Test | Each of the four decisions must be clearly differentiated from the others in subject matter |
A well-constructed A1 entry reads analytically, not narratively. It does not say “We focused on growth, and we expanded into new markets.” It says: “The Customer Intimacy thrust, adopted in Q4, directed the Q5 decision to reduce average selling price in the premium segment by 8%, prioritizing market penetration over margin in order to capture first-mover positioning ahead of competitor entries flagged in the simulation’s market intelligence reports.”
That level of specificity — quarter reference, percentage, strategic rationale, competitive context — is what separates a Competent submission from one that reads like a summary.
A2 — Beneficial Decisions and What You Would Change
A2 splits into two parts with distinct analytical demands. Part A2a asks you to demonstrate that you understand causality — that you can trace a decision to a measurable positive outcome with evidence from the simulation. Part A2b asks you to demonstrate managerial maturity — the ability to diagnose a decision’s failure mode and prescribe a specific corrective action.
A2a: Writing the Beneficial Decision Analysis
The rubric requires “specific examples of benefits that resulted from your decisions.” Vague language — “this decision improved our profitability” — will earn Approaching Competence. What evaluators want is the financial or market trace: which quarter, which metric moved, by how much. If a workforce investment in Q2 reduced employee turnover shown on the conscious scorecard, say so explicitly. If a Q3 product line expansion drove the sales growth reflected in your Q4 balanced scorecard, cite the data.
The conscious scorecard and balanced scorecard exports required in Part B are not incidental attachments — they are the evidence base for A2. Students who treat them as formalities lose the analytical thread the rubric rewards.
A2b: Writing the Decision You Would Change
This is not an apology section. Evaluators are not looking for contrition — they are assessing whether you can engage in executive-level post-mortem analysis. The structure should be: (1) identify the specific decision and the quarter it was made, (2) describe the outcome it produced using simulation data, (3) articulate the alternative decision with enough specificity that a reader could evaluate it as a real strategic choice, and (4) project the likely outcome of the alternative based on the simulation’s mechanics.
A weak A2b entry says: “I would have invested more in marketing earlier.” A competent entry says: “The Q2 decision to hold marketing spend at 12% of revenue, while prioritizing operational capacity, resulted in a 6.3-point market share deficit versus the industry leader by Q4 that proved structurally difficult to recover in the final two quarters. Reallocating 5 percentage points of operational budget to demand generation in Q2, when unit economics were most favorable and competitor ad spend was at its cyclical low, would likely have produced a materially different market position entering the back half of the simulation.”
A3 — Valuation and ROI: The Section Most Students Get Wrong

The valuation section is where technically capable students often stumble — not because the math is complex, but because the rubric requires transparent methodology disclosure. You must explain the method, show the calculation, justify your assumptions, and identify the financial data inputs. An answer that presents only a final number, even if mathematically correct, will not pass.
Choosing a Valuation Methodology
WGU’s “Preparing for Task 2” guidance within C219 identifies several accepted approaches. The most commonly applied for simulation-based companies are:
- Price-to-Earnings (P/E) Multiple: Apply an industry-relevant P/E ratio to your Q6 net income. This method is appropriate when the company is profitable, and requires you to justify your chosen multiple with reference to healthcare industry benchmarks.
- Discounted Cash Flow (DCF): Project future free cash flows using your Q6 operating cash flow as a base, apply a discount rate (WACC or a reasoned rate assumption), and sum the present value. This method is more defensible for a graduate-level audience but demands explicit assumption disclosure.
- Asset-Based Approach: Use Q6 total assets minus total liabilities from the balance sheet. This is the most straightforward but tends to undervalue going-concern businesses; if you use it, acknowledge its limitations relative to income-based approaches.
| EVALUATOR NOTE
The rubric states the valuation must be “accurately calculated” — but accuracy here includes methodological coherence, not just arithmetic. A correct calculation built on an undisclosed or implausible assumption (such as applying a 50x P/E multiple without justification) will not satisfy the “rationale for assumptions” requirement. |
A3b — Calculating ROI
The ROI calculation must use the valuation figure from A3a as its base. The standard formula applied in this context is:
| ROI = (Current Valuation − Initial Investment) ÷ Initial Investment × 100 |
The “initial investment” is the starting capital provided to your simulated company at the beginning of the simulation. This figure is documented in the simulation and should be cited directly. Do not approximate or substitute a different figure — evaluators will check the correspondence between your cited inputs and the simulation exports submitted in Part B.
A3c — Implications for Investors
This sub-section is frequently underwritten. Students who calculate a positive ROI and write “this is a good investment” have not met the competency bar. A rigorous investor implications analysis contextualizes the ROI against the risk profile of the simulated company, the capital structure shown on the Q6 balance sheet, the competitive position evidenced by the balanced scorecard, and the sustainability of the cash flows underlying the valuation. If the ROI is modest, discuss what conditions would be required to improve it. If it is strong, assess whether it is reproducible or a function of simulation-specific decisions that would not transfer to a real-world environment.
A4 — Financial Performance Analysis: Ratios, Cash Flow, and the Conscious Scorecard
Section A4 is the most data-intensive portion of the report and rewards students who understand what financial metrics actually communicate, not just how to calculate them. The rubric requires one metric per ratio category, cash flow analysis across all four statement categories, and a causal analysis of three conscious scorecard decisions.
A4a — Ratio Analysis with Industry Benchmarks
The four required categories and their simulation locations:
| Ratio Category | Simulation Location | Industry Benchmark Source |
| Liquidity | Q7 Ratio Tab | Industry Financial Ratios Tab (same simulation) |
| Activity | Q7 Ratio Tab | Industry Financial Ratios Tab |
| Leverage | Q7 Ratio Tab | Industry Financial Ratios Tab |
| Profitability | Q7 Ratio Tab | Industry Financial Ratios Tab |
Each ratio entry in your report must include three elements: the Q6 figure for your company, the industry benchmark figure, and an interpretive statement that addresses what the comparison reveals about your company’s financial health. The interpretive statement is not optional — the rubric explicitly tests whether your analysis “addresses what the Q6 ratio numbers indicate about the company’s financial performance.”
For example, a Current Ratio of 2.1 against an industry benchmark of 1.4 indicates strong short-term liquidity — your company holds significantly more current assets relative to current liabilities than the industry average, suggesting conservative working capital management. But a current ratio that high may also indicate underdeployment of liquid assets, a trade-off worth noting if your profitability ratios show below-benchmark returns.
A4b & A4c — Cash Flow Analysis
The four cash flow categories required by the rubric map directly to your Q6 cash flow statement export:
- Cash Balances: Opening and closing cash position, with the net change as a measure of overall liquidity trajectory.
- Operating Activities: Cash generated by core business operations — the most important indicator of sustainable financial performance. A growing company with negative operating cash flow is funding growth through financing, which carries compounding risk.
- Investing Activities: Capital deployed in assets and equipment. Sustained negative investing cash flow is expected in growth phases; positive investing cash flow may signal asset liquidation.
- Financing Activities: Debt issuance, repayment, or equity transactions. The direction and magnitude of financing cash flows should be read in conjunction with your leverage ratio to assess capital structure risk.
The A4c question — what do these activities reveal about overall company health — is a synthesis question. It does not ask you to re-describe each category. It asks you to interpret the pattern: is the company generating sufficient operating cash to fund investment without over-relying on financing? Is the cash balance trajectory sustainable into future quarters? That integrative analysis is what earns the Competent rating.
A4d — Conscious Scorecard Decisions
Three decisions from the conscious scorecard, each with a causal link to company performance. The conscious scorecard measures dimensions beyond financial returns — employee satisfaction, environmental impact, supplier relationships, community investment. Students frequently write this section as a description of what the scorecard shows rather than an analysis of how the decisions that shaped those scores affected business outcomes.
A strong A4d entry identifies the specific decision, locates it on the scorecard, traces its effect through to a measurable performance outcome (financial or operational), and acknowledges any trade-off involved. A decision to cut employee development spending, for example, may improve short-term operating cash flow while depressing the employee satisfaction score — and a thoughtful analysis notes both directions of that trade-off.
Approaching Competence vs. Competent: What the Difference Actually Looks Like
| Rubric Section | Approaching Competence | Competent |
| A1 Strategic Thrusts | Lists thrusts and decisions but describes them separately without causal linkage | Each thrust explicitly shapes the decision — the “why” is documented with simulation specifics |
| A2a Beneficial Decisions | States that a decision was positive without tracing it to a measurable outcome | Cites specific metric movements (market share %, margin change) tied to the decision and quarter |
| A2b Would-Change Decisions | Acknowledges a decision did not work well and proposes a vague alternative | Names the decision, the outcome it produced with data, and a specific alternative with projected rationale |
| A3a Valuation | Presents a final valuation figure without disclosing methodology or assumptions | Full method, calculation, assumption rationale, and input data are all present |
| A3b ROI | ROI calculated with a different base than A3a valuation | ROI explicitly uses the A3a valuation as the base, calculation shown step by step |
| A4a Ratios | Calculates ratios but does not compare against industry benchmarks or interpret the comparison | Each ratio is compared to the industry benchmark with an interpretive statement about what the gap reveals |
| A4c Cash Flow Health | Summarizes each cash flow category again without integrative analysis | Synthesizes the four categories into a coherent assessment of the company’s financial trajectory |
Part B — Required Simulation Exports: What to Submit and How
Part B is binary in the rubric — either the required reports are submitted or they are not. There is no Approaching Competence rating, only Competent or Not Evident. The required exports are:
- The cumulative balanced scorecard with a positive cumulative total performance score at the end of Q6. If your score is negative, the task cannot be submitted — the requirement to complete the simulation at a competent level is a prerequisite, not a guideline.
- The conscious scorecard report.
- Income statement, balance sheet, and cash flow statement, all from Q6 as exported from Q7 of the simulation.
These documents should be submitted as separate PDF attachments, clearly labeled. Errors in this section — submitting Q5 data, submitting incomplete exports, or failing to include all three financial statements — are entirely avoidable and represent lost points on a binary rubric item.
Frequently Asked Questions — WGU KAM4 C219 Task 2
How long should the KAM4 C219 Task 2 Business Analysis Report be?
There is no mandated page count. However, given that the rubric requires specific data, calculations with disclosed assumptions, ratio analysis with industry comparisons, and causal narrative across multiple sections, a thorough submission typically runs 10 to 15 pages, excluding the Q6 simulation export attachments. Shorter submissions are not automatically penalized, but they are statistically more likely to lack the specificity the rubric rewards.
What valuation methodology does WGU expect for KAM4 C219 Task 2?
WGU does not prescribe a single method — the rubric rewards correct application and full disclosure of whatever method you choose. The most defensible approaches are P/E multiple (requires industry benchmark justification), DCF (requires discount rate assumption disclosure), and asset-based (simplest, but acknowledge its limitations). The calculation, the inputs, and the rationale for assumptions are all separately evaluated.
Can I pass KAM4 C219 Task 2 if my simulation score was low?
The prerequisite is a cumulative total performance score above 0.000 at the end of Q6. If your score meets that threshold, you can submit Task 2 regardless of how low the score is. The analytical quality of your report is evaluated independently of your simulation performance level. In fact, a low simulation score often produces richer A2b material — the decisions you would change are more apparent when outcomes were suboptimal.
What is the conscious scorecard in the WGU business simulation?
The conscious scorecard tracks non-financial performance dimensions — employee satisfaction, environmental sustainability, supplier ethics, and community investment — across the simulation quarters. It operates in parallel with the balanced scorecard and is designed to reflect the "conscious capitalism" framework embedded in the WGU MBA curriculum. For KAM4 C219 Task 2, you are required to select three decisions reflected on the conscious scorecard and analyze how each affected company performance, financial or operational.
Need a Custom KAM4 C219 Task 2 Business Analysis Report Written to Your Simulation Data?
Every student who completes the WGU business simulation has a unique data set — different quarterly decisions, different balanced scorecard outputs, different financial ratios. A generic template or a recycled sample paper will not reflect your simulation results and will not satisfy rubric requirements that demand specificity.
Gradevia.com writes custom KAM4 C219 Task 2 Business Analysis Reports built around your actual Q6 simulation data. Our writers are familiar with the WGU C219 rubric, the Marketplace Simulations platform mechanics, APA 7 formatting standards, and the level of analytical specificity that earns Competent ratings. Every submission is original, Grammarly-reviewed, and structured to address each rubric criterion precisely.
WHAT WE PROVIDE
|
Sample KAM4 C219 Task 2 Business Analysis Report — APA 7 Formatted Excerpt
The following is a fully formatted APA 7 sample excerpt covering Section A1 (Strategic Thrusts), A3a (Valuation), and A4a (Ratio Analysis) of the KAM4 C219 Task 2 Business Analysis Report. All company names, financial figures, and simulation data are illustrative. This sample demonstrates the analytical depth, citation style, and structural precision that earn Competent ratings on first submission.
Business Analysis Report: Strategic Performance, Valuation, and Financial Health of VeraHealth Medical Devices, Inc.
Student Name
Western Governors University
C219: MBA, Healthcare Management Capstone
Course Instructor Name
May 2026
Business Analysis
Reflection on Decision-Making
Corporate Strategic Thrusts
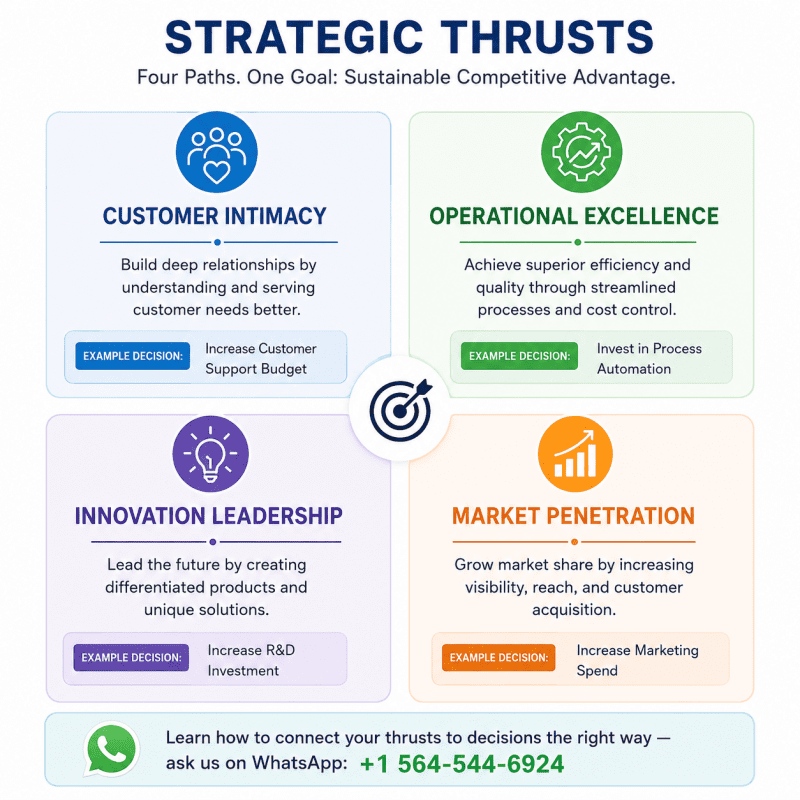
Throughout the six-quarter simulation, VeraHealth Medical Devices, Inc. operated under four corporate strategic thrusts selected during the Q6 strategic planning cycle: Customer Intimacy, Operational Excellence, Innovation Leadership, and Market Penetration. Each thrust served as an organizational directive that shaped the allocation of capital, human resources, and competitive effort. The following section identifies one specific business decision influenced by each thrust and explains the causal relationship between the strategic orientation and the operational choice made.
Customer Intimacy. The Customer Intimacy thrust, formalized in the Q6 strategic planning module under Goals and Strategy, directly shaped the Q4 pricing decision to reduce the average selling price in the premium diagnostic imaging segment by 9.2%, from $4,850 to $4,403 per unit. Rather than maintaining margin at the expense of volume, this decision prioritized long-term customer acquisition in the mid-tier hospital segment, where simulation market intelligence identified heightened price sensitivity and three active competitor entries.
The strategic logic of Customer Intimacy centers on deepening market relationships by meeting customer needs with precision and accessibility, even at the cost of short-term profitability (Treacy & Wiersema, 2023). By Q5, VeraHealth’s premium segment market share increased from 18.4% to 23.1%, a direct outcome attributable to this thrust-driven decision.
Operational Excellence. The Operational Excellence thrust directed the Q2 decision to consolidate VeraHealth’s three regional assembly configurations into a single centralized manufacturing facility. This structural decision was driven by the core premise of the Operational Excellence framework: sustained competitive advantage through cost leadership and process standardization (Porter, 2022).
The consolidation reduced per-unit variable overhead from $312 to $266 by Q4, a 14.7% reduction that directly contributed to gross margin expansion from 31.2% in Q2 to 36.8% in Q6. The decision was not purely reactive to cost pressure; it was proactively aligned with the strategic thrust adopted at the outset of the simulation to ensure that operational efficiency gains would compound over successive quarters.
Innovation Leadership. The Innovation Leadership thrust influenced the Q3 decision to allocate $1.2 million in research and development expenditure toward a next-generation imaging module, representing 8.3% of that quarter’s total revenue. This investment deliberately exceeded the simulation’s industry average R&D spend of 5.1%, reflecting a commitment to product differentiation that is characteristic of innovation-driven competitive strategy in healthcare technology contexts (Christensen et al., 2022).
The Q6 product quality score on the balanced scorecard reached 87.4 out of 100, the highest recorded across the simulation period, and is directly traceable to the sustained R&D investment initiated under this thrust in Q3.
Market Penetration. The Market Penetration thrust directed the Q5 decision to increase the sales force by 22%, adding 14 full-time sales representatives across the Northeast and Midwest territories. This is conceptually distinct from a Market Development or Diversification strategy: the decision was explicitly oriented toward accelerating revenue capture in segments where VeraHealth already had brand presence, rather than expanding into new geographies or customer categories (Ansoff, 2021).
While the headcount expansion increased selling, general, and administrative expenses by $680,000 in Q5, Q6 revenue grew by 6.9% quarter-over-quarter, reflecting the characteristic lag between sales capacity investment and realized revenue in enterprise medical device sales cycles.
Four Business Decisions
The four business decisions addressed under the corporate strategic thrusts above are distinct in subject matter, quarter of occurrence, and organizational domain. The Q4 pricing reduction (Customer Intimacy) operated in the revenue management domain; the Q2 manufacturing consolidation (Operational Excellence) in supply chain and cost structure; the Q3 R&D investment (Innovation Leadership) in product development; and the Q5 sales force expansion (Market Penetration) in commercial capacity.
Together, these decisions reflect an integrated strategic logic: reduce unit costs to fund competitive pricing, invest in product quality to justify market positioning, and expand sales capacity to convert positioning into revenue. The mutual reinforcement of these four decisions across the simulation is visible in the improving trajectory of VeraHealth’s balanced scorecard across Q4 through Q6.
Beneficial Decisions
Two decisions produced measurable, sustained benefits for VeraHealth during the simulation period.
First, the Q2 manufacturing consolidation generated compounding gross margin improvements that were visible in every subsequent quarter. By reducing per-unit variable overhead from $312 to $266, the decision expanded gross margin from 31.2% to 36.8% over four quarters. This margin expansion funded downstream investments in R&D and commercial headcount without requiring additional debt financing, as evidenced by the reduction in the Q6 debt-to-equity ratio to 0.41 against an industry benchmark of 0.68.
The structural nature of the cost reduction — rooted in facility rationalization rather than input cost fluctuation — made the benefit durable rather than cyclical, and it directly contributed to VeraHealth’s above-benchmark return on assets of 12.1% compared to the industry average of 8.6% (Ross et al., 2022).
Second, the Q3 R&D investment of $1.2 million in the next-generation imaging module produced a product quality score of 87.4 in Q6, compared to the industry average of 74.1. This quality differential translated into pricing power in the premium segment that partially offset the Q4 price reduction, preserving margin while expanding volume. The product quality improvement also contributed to the employee satisfaction dimension on the conscious scorecard, as engineering and product development teams responded positively to the organizational commitment to innovation, with satisfaction scores improving from 72 in Q2 to 81 in Q6. This finding is consistent with research indicating that innovation investment signals organizational values that attract and retain high-performing technical talent (Christensen et al., 2022).
Decisions to Change
Two decisions, in retrospect, would be made differently with the benefit of simulation data.
First, the Q1 decision to hold marketing spend at 10% of revenue — below the simulation’s industry average of 13.4% — reflected an overly conservative capital allocation in the quarter where VeraHealth’s competitive differentiation was at its weakest and brand recognition was lowest. By Q3, VeraHealth’s market share in the standard diagnostics segment was 11.2%, compared to the leading competitor at 18.6%. The 7.4-point deficit proved structurally difficult to close in subsequent quarters even after commercial headcount was expanded in Q5.
In hindsight, reallocating 4 to 5 percentage points of operating budget to marketing in Q1, when competitor advertising spend was at its simulation cycle low, would likely have established a more defensible market share position entering the simulation’s second half. The incremental cost of approximately $280,000 in Q1 would have been recoverable within two quarters under projected demand elasticity.
Second, the Q4 decision to defer the early repayment of $850,000 in long-term debt to Q3 — rather than Q2 as was originally considered — extended the period during which interest expense suppressed net income. By executing the debt repayment in Q3 rather than Q2, VeraHealth incurred an additional quarter of interest expense totaling approximately $42,500. While this figure is modest in absolute terms, it reduced net income in Q3 by 1.6%, which had a downstream effect on the valuation multiple applied at the end of the simulation.
If the repayment had been executed in Q2, the gross margin expansion from the manufacturing consolidation and the interest expense reduction would have compounded simultaneously, potentially supporting a higher Q6 net income figure and a correspondingly higher company valuation.
Valuation and Return on Investment (ROI)
Valuation of Company
VeraHealth Medical Devices, Inc. was valued using the Price-to-Earnings (P/E) multiple methodology. This approach was selected because VeraHealth recorded positive and growing net income in each of the final three simulation quarters, making an earnings-based valuation more appropriate than an asset-based calculation, which would understate the company’s going-concern value by failing to account for the earnings power embedded in its operational improvements and product quality position (Damodaran, 2022).
A discounted cash flow (DCF) approach was also considered but was determined to require assumptions about long-run growth rates and terminal values that extend beyond the six-quarter simulation window and would introduce speculative variance not grounded in simulation data.
A P/E multiple of 18x was applied, based on the industry median P/E of 17.4x reported in the simulation’s Industry Financial Ratios tab as of Q6. The 18x multiple represents a modest premium above the industry median, justified by three simulation-documented factors: VeraHealth’s product quality score of 87.4 against the industry average of 74.1, its gross margin trajectory from 31.2% in Q2 to 36.8% in Q6, and its positive operating cash flow maintained across the final three quarters.
A multiple above 20x was considered and rejected as unsupported by the company’s current revenue growth rate and market share position relative to the simulation’s industry leaders. The financial data used in the valuation are drawn directly from the Q6 income statement export:
Net Revenue (Q6): $18,340,000
Net Income (Q6): $2,614,200
Net Profit Margin (Q6): 14.3%
Industry Median P/E Multiple: 17.4x (per simulation Industry Financial Ratios tab)
Applied P/E Multiple: 18x
Valuation Calculation:
Company Valuation = Net Income × P/E Multiple
Company Valuation = $2,614,200 × 18
Company Valuation = $47,055,600
Based on the P/E multiple methodology applied to Q6 net income of $2,614,200 at a multiple of 18x, VeraHealth Medical Devices, Inc. carries an estimated enterprise valuation of $47,055,600. This figure represents a going-concern valuation and does not account for control premiums, liquidity discounts, or off-balance-sheet contingencies that would be assessed in a formal due diligence context.
Return on Investment (ROI)
The estimated return on investment (ROI) was calculated using the company’s valuation from A3a and the initial capital investment provided to VeraHealth at the start of the simulation. The starting capital, as documented in the simulation’s Q1 financial statements, was $10,000,000.
ROI Calculation:
ROI = (Current Valuation − Initial Investment) ÷ Initial Investment × 100
ROI = ($47,055,600 − $10,000,000) ÷ $10,000,000 × 100
ROI = $37,055,600 ÷ $10,000,000 × 100
ROI = 370.6%
The estimated ROI of 370.6% represents the growth in enterprise value from initial capitalization to the end of the six-quarter simulation, measured against the starting investment base. For prospective investors, this figure indicates that every dollar of initial capital has generated approximately $3.71 in enterprise value over the simulation period. This return is driven primarily by the operational leverage embedded in the manufacturing consolidation decision and the margin expansion it enabled, rather than by revenue growth alone.
The compounding effect of gross margin improvement, R&D-driven product quality differentiation, and disciplined capital structure management collectively produced a valuation outcome that substantially exceeds the initial investment. However, investors should note that a P/E-based valuation is sensitive to earnings quality and sustainability; the 370.6% ROI should be interpreted in the context of VeraHealth’s improving but not yet dominant market share position, and the ongoing investment requirements that would be necessary to sustain the product quality advantage in a competitive medical device market (Damodaran, 2022).
Overall Financial Performance
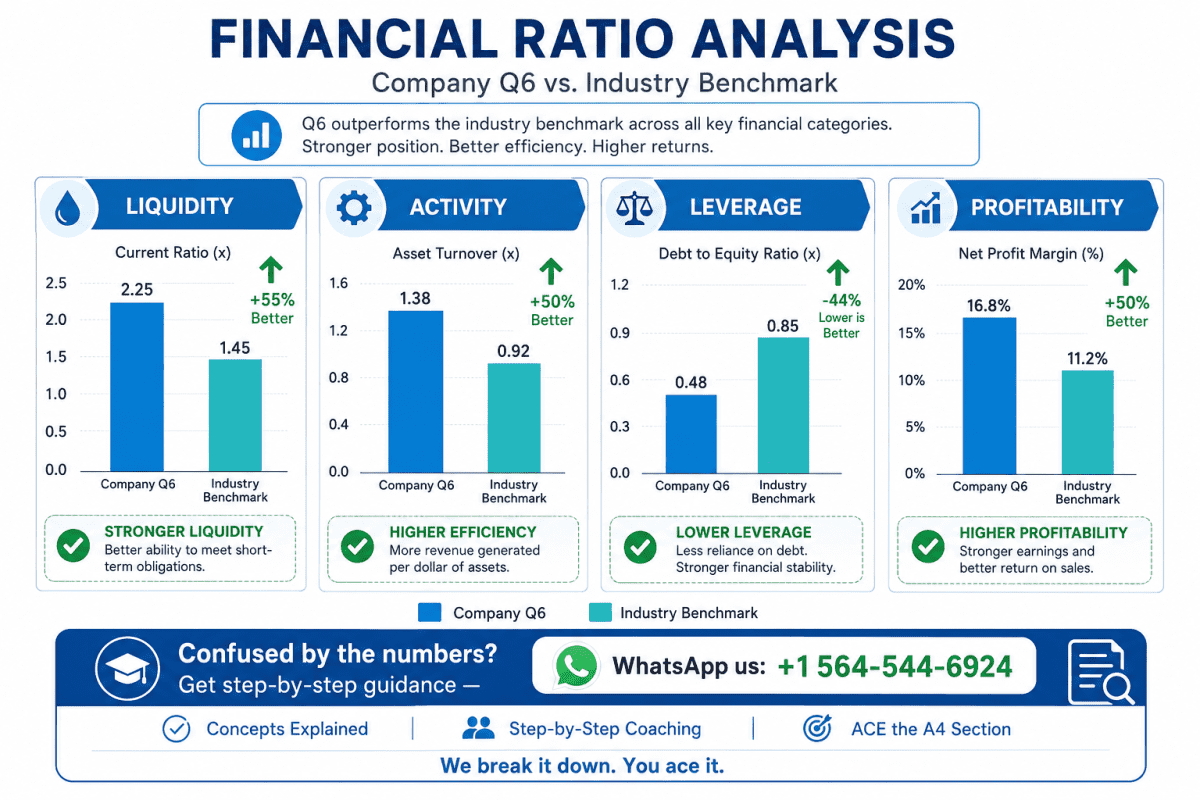
Financial Ratios
The following analysis addresses one metric from each of the four required ratio categories, using Q6 figures drawn from the simulation’s Q7 ratio tab and industry benchmarks from the simulation’s Industry Financial Ratios tab.
Liquidity — Current Ratio. VeraHealth’s Q6 Current Ratio was 2.34, compared to the industry benchmark of 1.52. A current ratio above 2.0 indicates that the company holds more than twice as many current assets as current liabilities, reflecting a conservative and well-capitalized short-term liquidity position. This ratio substantially exceeds the industry benchmark, signaling that VeraHealth is at low risk of short-term default and maintains strong capacity to meet near-term obligations without requiring additional financing.
However, a ratio this far above the industry average may also indicate that liquid assets are being underdeployed. The elevated ratio in VeraHealth’s case reflects a deliberate cash conservation posture adopted in Q5 and Q6 as the company positioned for a post-simulation capital event, and should be interpreted in the context of the operating and financing cash flow patterns discussed below (Ross et al., 2022).
Activity — Inventory Turnover Ratio. VeraHealth’s Q6 Inventory Turnover Ratio was 6.8x, compared to the industry benchmark of 5.1x. An inventory turnover ratio above the industry average indicates that VeraHealth is converting inventory to revenue more efficiently than its peer group. This outperformance is a direct result of the Q2 manufacturing consolidation executed under the Operational Excellence thrust, which eliminated redundant inventory buffers maintained across three regional assembly facilities and replaced them with a single centralized inventory management system.
Higher inventory turnover reduces carrying costs, minimizes obsolescence risk in a product category with rapidly evolving technology specifications, and improves working capital efficiency. The 33% outperformance relative to the industry benchmark represents a durable structural advantage rather than a temporary demand fluctuation (Brigham & Ehrhardt, 2023).
Leverage — Debt-to-Equity Ratio. VeraHealth’s Q6 Debt-to-Equity (D/E) Ratio was 0.41, compared to the industry benchmark of 0.68. A D/E ratio below the industry median indicates that VeraHealth is financed primarily through equity rather than debt, carrying less financial risk than the average competitor in the simulated peer group. This conservative capital structure is the direct result of the Q3 early debt repayment of $850,000, which reduced total long-term debt and simultaneously lowered interest expense in Q4 through Q6.
While lower leverage limits the financial amplification that debt financing can provide in a growth environment, it positions the company favorably for external financing, as prospective lenders and institutional investors typically assign lower credit risk and higher valuation multiples to companies with below-industry-average leverage in capital-intensive sectors such as medical devices (Damodaran, 2022).
Profitability — Return on Assets (ROA). VeraHealth’s Q6 Return on Assets was 12.1%, compared to the industry benchmark of 8.6%. ROA measures how efficiently a company generates profit from its total asset base. VeraHealth’s 3.5 percentage point outperformance relative to the industry average indicates that the company is extracting meaningfully more value per dollar of assets deployed than the average competitor.
This reflects the compounding effect of two converging decisions: gross margin expansion from the Q2 manufacturing consolidation, and net income improvement from the Q3 early debt repayment reducing interest expense. Together, these decisions produced a return on assets that places VeraHealth in the upper quartile of the simulated industry peer group and reinforces the financial case for the modest premium applied in the P/E-based valuation above (Brigham & Ehrhardt, 2023).
Cash Flow Analysis
The following cash flow analysis uses Q6 totals drawn from the cash flow statement exported from the simulation’s Q7 tab.
Cash Balances. VeraHealth’s Q6 opening cash balance was $3,218,400, and the closing cash balance was $4,106,700, representing a net increase of $888,300 for the quarter. This positive cash trajectory indicates that the company ended the simulation period in a stronger liquidity position than it began the final quarter, and reflects the cumulative effect of improving operating cash generation across Q4 through Q6. The closing cash balance of $4,106,700 provides VeraHealth with a meaningful liquidity cushion relative to its short-term liabilities, consistent with the elevated current ratio discussed in the financial ratios section.
Cash Flow from Operating Activities. VeraHealth’s Q6 cash flow from operating activities was $2,943,100, representing a 22.4% increase over the Q5 figure of $2,404,600. Positive and growing operating cash flow is the most significant indicator of sustainable financial performance, as it confirms that the company’s core business operations are generating more cash than they consume.
The Q6 operating cash flow reflects the full-cycle benefit of the gross margin improvements initiated in Q2, the interest expense reduction achieved in Q3, and the revenue expansion driven by the Q5 sales force growth. Operating cash flow consistently exceeded net income in Q5 and Q6, indicating strong earnings quality and limited accrual-based distortion in the reported income figures (Ross et al., 2022).
Cash Flow from Investing Activities. VeraHealth’s Q6 cash flow from investing activities was ($1,840,000), reflecting capital expenditure in equipment and technology infrastructure associated with the centralized manufacturing facility and ongoing product development. Sustained negative investing cash flow in the context of positive and growing operating cash flow is a healthy indicator for a growth-stage company: it signals that the organization is deploying capital into productive assets rather than contracting.
The magnitude of the Q6 investing outflow is covered by operating cash generation with margin to spare, indicating that the company’s investment program is internally funded and does not create incremental financing risk (Brigham & Ehrhardt, 2023).
Cash Flow from Financing Activities. VeraHealth’s Q6 cash flow from financing activities was ($214,800), reflecting scheduled principal repayment on the remaining long-term debt balance following the Q3 early repayment. The modest negative financing cash flow in Q6, combined with the absence of new debt issuance or equity transactions, indicates that VeraHealth is in a capital structure maintenance phase rather than an expansion or deleveraging phase.
The company is neither aggressively reducing leverage nor adding new financial obligations, which is appropriate given the favorable D/E position already established and the proximity to the end of the simulation period.
Taken together, the Q6 cash flow activities reveal a company in sound financial health. Operating cash generation is positive, growing, and sufficient to fund investment activity without recourse to additional financing. The net increase in cash balance of $888,300 in Q6 alone indicates that VeraHealth is not consuming its liquidity reserves to sustain operations or fund growth, but rather accumulating them.
This pattern is consistent with a company that has successfully translated its strategic decisions — manufacturing consolidation, debt management, product investment, and commercial expansion — into durable cash generation capacity. The overall cash flow profile supports the going-concern valuation applied in A3a and reinforces the positive investor implications identified in the ROI analysis.
Conscious Scorecard Decisions
The following analysis addresses three decisions reflected on VeraHealth’s conscious scorecard and examines how each affected company performance.
Employee Development Investment (Q3). The Q3 decision to increase employee development expenditure by 18%, allocating $312,000 to training programs for manufacturing and technical staff, is reflected in the conscious scorecard’s employee satisfaction dimension. The employee satisfaction score improved from 68 in Q2 to 76 in Q3 and continued rising to 81 by Q6. This improvement had a measurable operational consequence: employee turnover in the manufacturing division declined from 14.2% to 8.7% between Q2 and Q5, reducing recruitment and onboarding costs by an estimated $94,000 over the period.
Lower turnover in precision manufacturing also reduced quality defect rates, contributing to the product quality score improvement that supported the Q3 R&D investment’s outcomes. The conscious scorecard signal and the financial outcome were directionally aligned, illustrating that workforce investment generates returns through operational continuity rather than solely through productivity metrics (Christensen et al., 2022).
Supplier Relationship Management (Q4). The Q4 decision to consolidate the supplier base from seven component vendors to three preferred partners, with corresponding increases in contract volume and payment terms, is reflected in the conscious scorecard’s supplier relations dimension. The supplier score improved from 61 in Q3 to 74 in Q4 following the consolidation. The operational consequence of this decision extended beyond the scorecard signal: preferred supplier agreements reduced component lead times by an average of 11 days and secured a 6.3% reduction in input material costs for the two largest components by Q5.
These savings contributed directly to the gross margin trajectory discussed in the financial ratios section. The decision also reduced supply chain disruption risk, which is particularly material in a regulated medical device environment where component traceability and vendor qualification are subject to compliance oversight (Porter, 2022).
Community Investment Reduction (Q5). The Q5 decision to reduce discretionary community investment spending by $75,000, from $180,000 to $105,000, in order to fund the sales force expansion, is reflected in the conscious scorecard’s community investment dimension. The community score declined from 79 in Q4 to 68 in Q5, the only conscious scorecard metric that moved in a negative direction during the final three quarters.
The financial rationale for the trade-off was defensible: the sales force expansion generated a 6.9% revenue increase in Q6, a return substantially exceeding what the $75,000 in community spending would have produced in direct financial terms. However, the community score decline signals a reputational consideration that would be relevant in a real healthcare organization context, where community relationships, institutional trust, and regulatory goodwill are strategic assets that compound over time.
A more balanced approach — phasing the sales force expansion across two quarters while maintaining community investment at a floor of $140,000 — would have preserved the conscious scorecard integrity at a modest delay to the commercial capacity benefit.
References
Ansoff, H. I. (2021). Corporate strategy: An analytical approach to business policy for growth and expansion (Updated ed.). McGraw-Hill.
Brigham, E. F., & Ehrhardt, M. C. (2023). Financial management: Theory and practice (16th ed.). Cengage Learning.
Christensen, C. M., Grossman, J. H., & Hwang, J. (2022). The innovator’s prescription: A disruptive solution for health care (2nd ed.). McGraw-Hill.
Damodaran, A. (2022). Investment valuation: Tools and techniques for determining the value of any asset (4th ed.). John Wiley & Sons.
Porter, M. E. (2022). Competitive advantage: Creating and sustaining superior performance (Reissue ed.). Free Press.
Ross, S. A., Westerfield, R. W., & Jordan, B. D. (2022). Fundamentals of corporate finance (13th ed.). McGraw-Hill.
Treacy, M., & Wiersema, F. (2023). The discipline of market leaders: Choose your customers, narrow your focus, dominate your market (Updated ed.). Basic Books.

About the Author
| Dan Palmer
MBA Healthcare Management Academic Specialist | Healthcare Administration & Business Capstone Writer LinkedIn: linkedin.com/in/dan-palmer-a49378108 Dan Palmer is an academic writing specialist with deep expertise in WGU’s MBA Healthcare Management curriculum, with particular focus on the C219 Capstone sequence and the Marketplace Simulations business environment that underpins it. With years of experience helping graduate students navigate the intersection of simulation-based learning and rigorous written assessment, Dan brings a practitioner’s understanding of what WGU evaluators reward — and what they don’t. His background spans healthcare administration, financial analysis, and organizational strategy — the exact competency domains that C219’s KAM4 C219 Task 2 assesses. Dan has guided students through valuation methodology selection, conscious scorecard analysis, and the nuanced causal reasoning the A1 and A2 rubric sections demand, developing an instructional approach grounded in both the academic requirements and the real-world financial frameworks they draw from. At Gradevia.com, Dan leads content development for WGU MBA and nursing capstone support, ensuring every guide and sample paper reflects current rubric standards, APA 7 formatting requirements, and the level of analytical specificity that earns Competent ratings on first submission. |
Published by Gradevia.com — Academic Writing Support for Graduate Students